A technical memo is a document that enables a student to explain how they solved a problem. These problems are not your usual textbook problems. They are problems typically correspond to projects and require several steps They have multiple possible solution strategies. Often the problems are not well stated so much effort goes into understanding what is being asked for. Technical memos are useful when a problem requires a significant amount of interpretation, strategy, and calculation.
During the first project, I provide the students with samples of technical memos. Using these samples, I work with the students to help them understand the components of the document. Let’s look at the components of a technical memo.
Title and Authorship: Every document needs a title that reflects what is being discussed and/or solved. A technical memo should not have a cute title or an incredibly complicated title. The title should attract the reader to go farther and read the next part of your memo. THe authors name and affiliation should be placed under the title. For my purposes, I also require students to include the date on which the memo is submitted (due date).
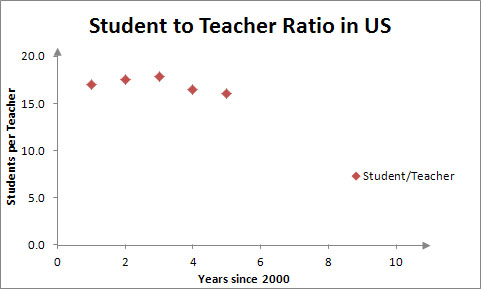
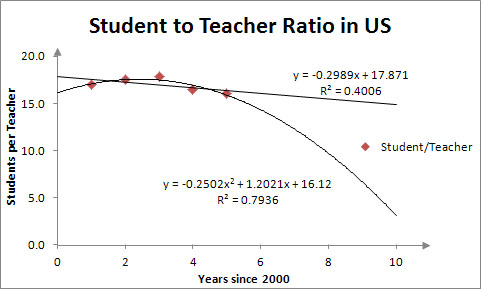
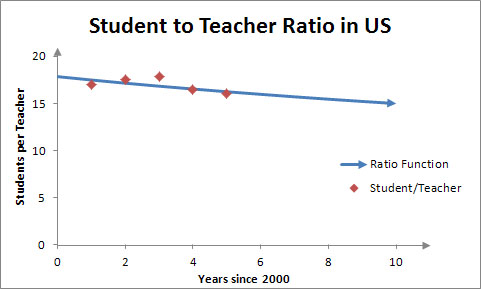
Introduction: The first section of your memo is the Introduction. It should be named as the Introduction to make it easy for the reader to identify. In this section the student needs to demonstrate that they understand the problems as it was given to them. A good way to do this is to restate the problem in their own words. If any part of the problem is unclear, the student should clarify them and state the assumptions they used. A diagram may help them to clarify the problem. The student should identify and show any data or quantities that were provided in the project letter. The student should say exactly what they are looking for in the problem and the general direction of their solution. If the student is analyzing how the student to teacher ratio is changing in a state, they should include the data they used, what is the student to teacher ratio, the basic technique used to solve the problem, and the basic answer. You never hide the solution from your reader. By supplying an answer, you rely upon your readercuriosity to draw them into your memo to learn more. If they are an untrusting soul, they will want to scrutinize the entire solution you supply in the rest of the memo.
Materials and Methods: The name of this section can be a bit misleading. The word Materials is often left out in technical memos on mathematical solutions. It comes from the fact that this type of memo forms the foundation for lab reports in the sciences like biology and chemistry. In these technical memos or lab reports, it is appropriate to talk about the materials used in an experiment. Usually in a mathematical technical memo we don’t use materials like chemicals so you may leave out the term Materials and simply call this section Methods.
In this section, students lay out their strategy for solving the problem in general terms. Without actually solving the problem, they want to explain what they are going to do and what mathematical tools they will need to do this. they may need to explain how these tools work because your reader may be unfamiliar with them. For instance, if they will be solving a quadratic equation as a part of your strategy, they will want to show the quadratic formula and how it applies to your specific instance.
Students should use mathematical terminology in their explanation. They may even need to explain the terminology so that the reader can follow what they are saying. The tough part for students is determining how much detail they should go into. They need to give enough detail so the reader can follow the calculations, but they don’t want to do the calculations in the Methods section. Save the calculations for the Results section. The only exception to this general rule is if the strategy involves a repetitive calculation. If the student to teacher ratio must be calculated several times from data, it is perfectly acceptable to show a sample calculation in the Methods section.
Results: In this section students carry out the strategy that they laid out in the Methods section. This may include solving equations, recognizing patterns, interpreting graphs. Don’t expect the equations and graphs to speak for themselves. Lead your reader through your calculations using your strategy from the Methods section as a guide. They should use words and complete sentences in the Results section.
Discussion: In the Discussion section the student should summarize your results and check your solution if possible. Does the solution make sense with reality? How does the solution relate to the real world or the big picture? Can they generalize your solution? I often ask question that require them to compare models and the Discussion section is an excellent place for them to do this. In some projects, it is not possible to solve the problem as stated. In the Discussion section, the student then explains how the problem can be modified to allow a reasonable solution.
In grading a technical memo, I consider a number of questions:
Conceptual Understanding
Key Question: Does the student’s interpretation of the problem using mathematical representations and procedures accurately reflect the important mathematics in the problem?
Strategies and Reasoning
Key Question: Is there evidence that the student proceeded from a plan, applied appropriate strategies, and followed a logical and verifiable process toward a solution?
Computation & Execution
Key Question: Given the approach taken by the student, is the solution performed in an accurate and complete manner?
Communication
Key Question: Was I able to easily understand the student’s thinking or did I have to make inferences and guesses about what they were trying to do?
Insights
Key Question: Does the student grasp the deeper structure of the problem and see how the process used to solve this problem connects it to other problems or real-world applications?
If the student has followed the format described above (Intro, Methods, Results Discussion), I can easily determine the answer these questions and rate their performance. In the Problem Solving Scoring Guide below (adapted from the Northwest Regional Educational Laboratory), you can see the criteria I use rate a student’s performance on each of these questions.