How Do You Find The Future Value Of An Annuity in Google Sheets?

Google Sheets has several built in functions for working with annuities. To use these functions, we’ll start with a standard Sheets worksheet.

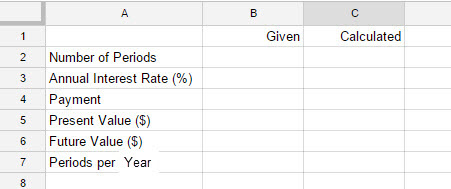
sheets_financial_01

This worksheet contains the variables used throughout Chapter 5. Values given in a problem will be entered in column B. Values calculated by Sheets will be entered in column C. We will also assume that amounts paid out are negative and amounts received are positive.

We’ll modify the worksheet shown above. This will allow us to use Sheets to calculate the different amounts in the annuity formula,

sheets_financial_19

This is done using two functions in Sheets, the FV (future value) function and the PV (present value) function. Annuities have a regular payment into or out of the account. If the payment is made at the end of the compounding period, the annuity is called an ordinary annuity. Payments are made at the beginning of the compounding period for an annuity due. In Sheets, amounts that you pay out are considered negative numbers and amount you receive are positive amounts.

Find the Future Value of the Annuity

An investor deposits $500 in a simple annuity at the end of each six-month payment period. This annuity earns 10% per year, compounded semiannually.

a. Find the future value if payments are made for three years.

Solution Since the investor is paying $500 into the annuity, the payment must be entered as a negative number in Sheets.

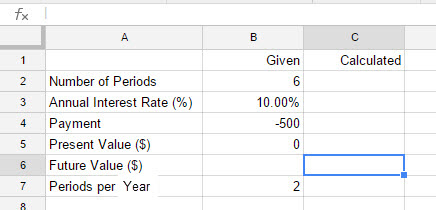
1. Start from the basic worksheet and enter the values shown below.

sheets_financial_12

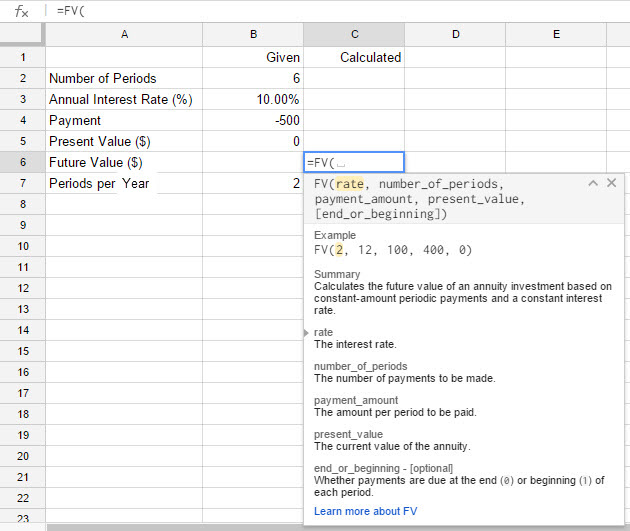
2. Click in cell C6. Type =FV( in the cell. As soon as you type the parentheses, Sheets recognizes what you are trying to do.

sheets_financial_13

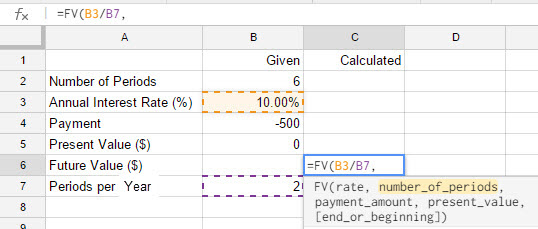
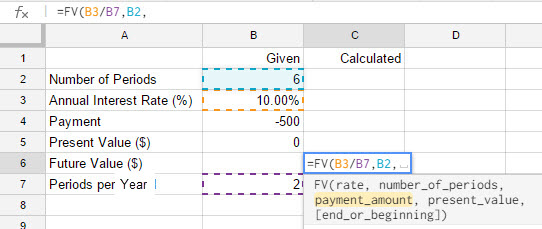
3. Notice that the word rate is highlighted. This indicates that you need to either type in the rate or the cell reference where the rate is located. The rate for the command is actually the interest rate per period. The annual interest rate is in cell B3 and the number of periods per year is in cell B7. We need to get the interest rate per period by typing B3/B7. You can also click in cell B3, type a /, and then click the cursor in cell B7. Now type a comma.

sheets_financial_14

4. The number of periods is in cell B2. Type B2 or click the cursor in that cell. To continue to the next input, type a comma.

sheets_financial_15

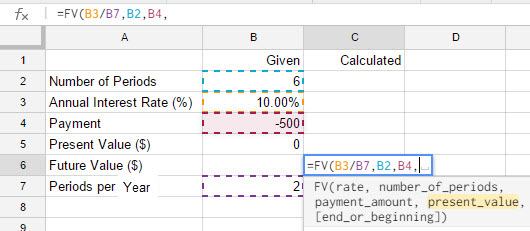
5. The payment is located in cell B4. The value is negative since the money is paid out. Type B4 or choose cell B4 followed by a comma.

sheets_financial_16

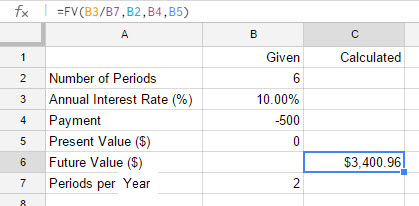
6. Since we deposit nothing into the account initially, the present value is zero. Enter B5 or select cell B5 followed by a comma and a parentheses. Press enter on the keyboard to calculate the future value.

sheets_financial_17

The future value of the annuity is $3400.96. There is an optional argument for the FV function. This argument indicates whether the annuity is an ordinary annuity (use 0 for the argument) or an annuity due (use 1 for the argument).

Ordinary Annuity: FV(B3/B7,B2,B4,B5,0)
Annuity Due: FV(B3/B7,B2,B4,B5,1)

If the last argument is not supplied, the annuity is assumed to be an ordinary annuity.

b. Find the future value if payments are made for 30 years.

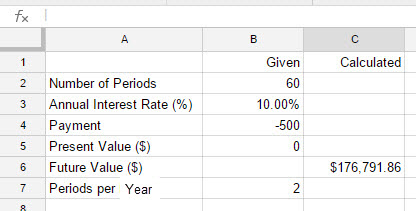
Solution Thirty years of semiannual payments corresponds to n = 60. We need to make this change in the FV function, and solve for future value again. Change the value in cell B2 to 60.

sheets_financial_18

The future value is now $176,791.86.

How Do You Graph An Absolute Value Function in Desmos and WolframAlpha?

Graphing an absolute value function can be a bit deceiving. Depending on the technology you use, the graph you get may not actually represent the function well.

Let’s graph the function

using WolframAlpha and Desmos. These two online graphing tools are both free to use and can produce excellent graphs.

To graph this function in WolframAlpha, go to the website and type this in the box on the screen.

Both the numerator and denominator need to be in parentheses. The absolute value function in WolframAlpha is “abs”. Putting this in front of (x+4) means the absolute value of the quantity x + 4.

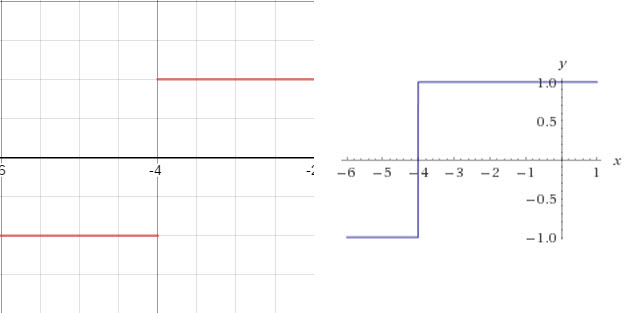
Press return to give the following result.

The graph consists of a horizontal section at y = -1 and another at y = 1. These sections are connected by a vertical line at x = -4. This is problematic since this is not a function…it does not pass the vertical line test at x = -4.

Let’s try graphing this function in Desmos.


As shown in the video above, the graph of this function looks like this in Desmos.

This looks similar to the WolframAlpha version, except that the tow horizontal pieces are not connected. As noted in the video,

is undefined at x = -4. This is because x = -4 causes the denominator to be zero.

This might not seem like a big deal. But if you were determining whether the function was continuous at x = -4, the two graphs would lead to different conclusions. The WolframAlpha graph would lead you to think the function is continuous. Desmos would give the opposite conclusion.

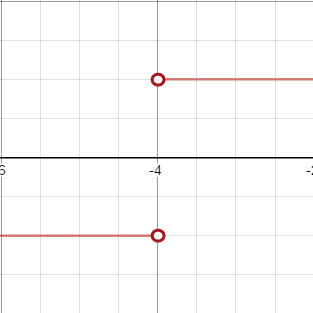
In this case, Desmos gives a more accurate graph since it shows the discontinuity at x = -4. An even better version of this graph would be to include open circles at x = -4.

This not only shows the discontinuity, but also indicates that the function is undefined at x = -4. To put these on the graph I downloaded the image and then added the circles in an image editing program like Paint.

How Do You Find Compound Interest Future Value In Google Sheets?

Spreadsheets have several built in functions for working with compound interest and annuities. To use these functions, we’ll start with a standard sheet.

sheets_financial_01

This worksheet contains the variables used throughout Chapter 8. These variables correspond to these letter used in the text.

  • Number of periods is n
  • Annual interest rate is r
  • Payment is R
  • Present value is P
  • Future value is A
  • Periods per year is m

Values given in a problem will be entered in column B. Values calculated by the spreadsheet will be entered in column C. We will also assume that amounts paid out are negative and amounts received are positive.

Continue reading “How Do You Find Compound Interest Future Value In Google Sheets?”

How Can You Use a Spreadsheet To Carry Out The Simplex Method?

The row operations in the Simplex algorithm are not difficult to compute.  To start, you should carry out the row operations in the process by hand. As you will quickly realize, the Simplex algorithm is tedious and prone to arithmetic errors. Once you get the idea behind how the Simplex method works, you can carry out the row operations in a spreadsheet.

In the video below, the steps in the Simplex Methods are carried out in Google Sheets. The same steps can also be carried out in other spreadsheets such as Microsoft Excel.

Please note that there is a typo in the original matrix in the process. The cell in D2 should be a 1 instead of a zero to account for the slack variable in the first constraint.

How Can You Format Numbers As Fractions In Google Sheets?

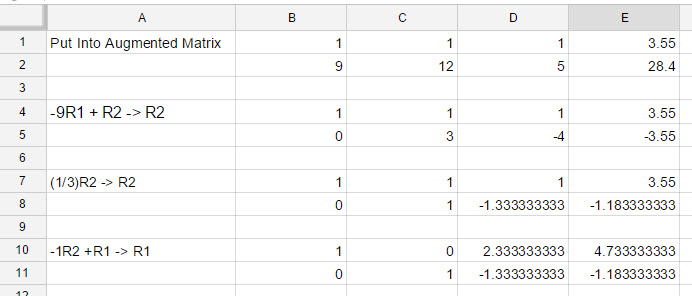
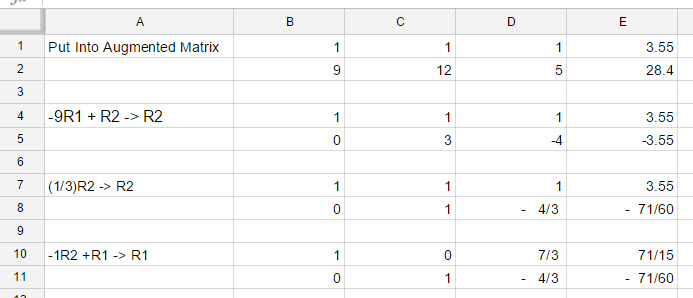
When carrying out row operations in Google Sheets, you may end up with cells whose entries are very long (repeating?) decimals. If you round these numbers, you are potentially changing the solution to the problem you are doing. It would be nice to be able to show the numbers in the lower right hand portion of the picture above as fractions.

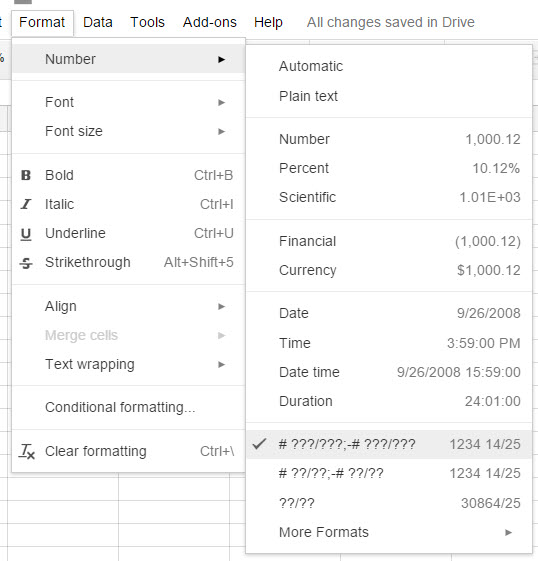
Luckily this is possible by formatting those cells with a custom format. To do this, drag select the cells you want to format this way. With the cells selected, go to the Format menu and choose Number.

At the bottom of the this menu is submenu called More Formats. When you choose that option, another menu will appear.

Choose Custom Number Format. This will open a box in which you can customize how the number appears in the cell.

Enter the characters shown above and then press Apply. Make sure the characters start with an underscore ( _ ) and contain a space between the # and the ?.

All of the numbers in the selection will now be written as fractions.

A quick spot check show that cell D8 had contained the decimal -1.333333333. With the new formatting, it appears as the fraction -4/3.

By using the fraction in your solution, you can avoid rounding until the very last step of the calculation where it is more appropriate to round.