
Approximate Linear Models
In section 1.2, we found the demand function D(Q) for a dairy. The scatter plot and corresponding linear function are pictured in Figure 1.
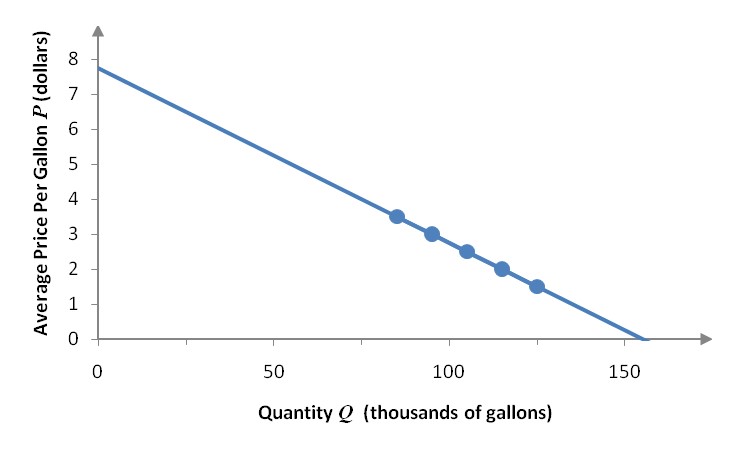
Figure 1 – The demand function D(Q) = -0.05Q + 7.75 for the data in Example 7 of section 1.2.
In this scatter plot, the function passes through each point perfectly. In other words, the prices at each quantity in the data match the prices from the function at the corresponding prices. This occurred because the slopes between adjacent ordered pairs were exactly the same. In this section we’ll find linear models for data that do not lie along a straight line.
Read in Section 1.3
- Which linear model is best?
- How do you use linear regression functions?
- How good is the linear model?
Section 1.3 Workbook (PDF) 8-18-19
Watch Video Playlist

Applications
- MathFAQ – How Do I Find A Linear Model using Linear Regression?
- Handout: Linear Regression in Excel
- Handout: Linear Regression TI Graphing Calculator