
Solving a System of Linear Inequalities
 Figure 1 – A copper brewing kettle at a craft brewery.
In Chapter 2, we were concerned with systems of linear equations. In this section, we’ll change the equal signs in systems of linear equations to inequalities to yield systems of linear inequalities. Systems of linear inequalities occur frequently in business where production is constrained by the availability of materials, labor, or transportation.
For instance, over the last twenty years craft beer has become very popular. One of the largest craft breweries produces five different beers throughout the year. The monthly capacity of the brewery is 50,000 barrels of beer (one barrel is 31 gallons). If x1 through x5 represent the monthly production of each of the different types of beer in barrels, we can write![]() The sum of the variables represents the total monthly production, so setting this sum equal to 50,000 tells us the brewery is operating at its monthly capacity of 50,000 barrels.
The sum of the variables represents the total monthly production, so setting this sum equal to 50,000 tells us the brewery is operating at its monthly capacity of 50,000 barrels.
However, the brewery may not operate at its full capacity. If the brewery is producing less than 50,000 barrels of beer, we would write![]()
The inequality points to the smaller quantity so the expression on the left, the total monthly production, is smaller than 50,000 barrels. If the brewery is operating above capacity, the inequality![]()
indicates the total monthly production is greater than 50,000 barrels. Inequalities with < or > are called strict inequalities.
Inequalities may also involve a combination of <, >, and =. By writing![]()
we know that the brewery is operating at or below capacity. We would read this as the total monthly production, x1 + x2 + x3 + x4 + x5, is less than or equal to 50,000. If the inequality is reversed,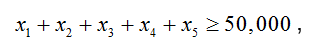
we say that the total monthly production is greater than or equal to 50,000 barrels.
In this section, we’ll examine solutions of inequalities involving two variables. When only two variables are involved, we can graph the solutions on a rectangular coordinate system and shade the region of the graph where the ordered pairs satisfy the inequality. The ordered pairs satisfying the inequality result in a true statement when they are substituted into the inequality.
Let’s check to see if the ordered pair (x, y) = (3, 2) satisfies the inequality x – 2y < 5. By setting and in the inequality, we get the statement
3 – 2(2) < 5
The left side of the inequality is equal to -1. This value is less than 5 so the inequality is true and the ordered pair satisfies the inequality. The ordered pair (x, y) = (6, -2) does not satisfy the inequality x – 2y < 5 since
6 – 2(2) < 5
is not a true statement.
In a graph of the inequality , all ordered pairs satisfying the inequality lie in the shaded region in Figure 2. Ordered pairs that do not satisfy the inequality lie in the unshaded region or on the dashed border of the shaded region.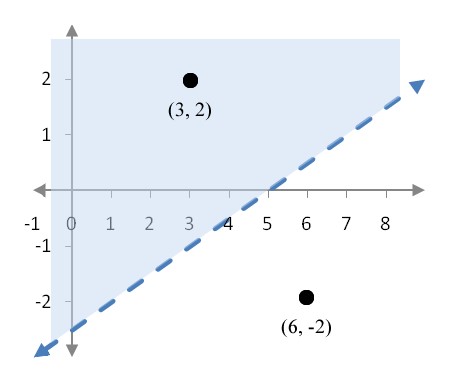
Figure 2 – All ordered in the shaded region satisfy the inequality x – 2y < 5. Ordered pairs on the dashed line like (5, 0) do not satisfy the inequality x – 2y < 5.
Read in Section 4.1
Section 4.1 Workbook (PDF) – 10/8/19
Watch Video
