When a quantity increases or decreases at a constant rate, a linear model like those in Section 4.2 is appropriate. The graph of a linear model is a line and often you may decide to use a linear model if you think a straight line might be useful.
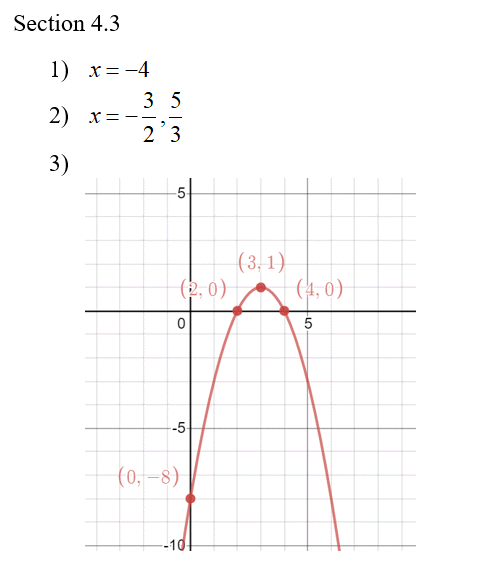
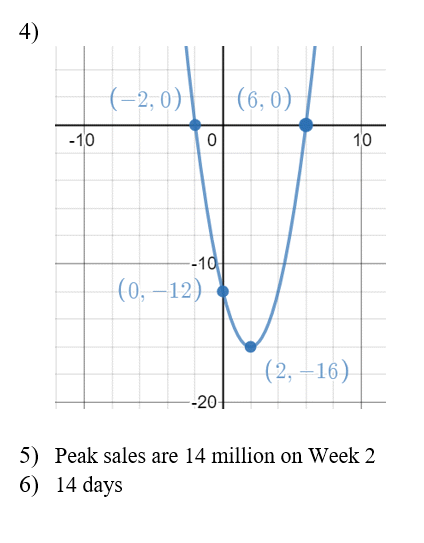
If a quantity is increasing and then changes to decreasing (or vice versa), a linear model will be a poor choice to model the quantity. In this case, a parabola will be a better choice.
Parabolas are equations that have the form
y = a x2 + b x + c
where a, b, and c are numbers (with a ≠ 0). Models that utilize this equation are called quadratic models.
Our objectives in this section are
- To use the quadratic formula to solve quadratic equations.
- To graph a quadratic equation using the vertex and intercepts.
- To use a quadratic equation to model data.
Use the workbook and videos below to help you accomplish these objectives.
Section 4.3 Workbook (PDF) 10/19/19
Section 4.3 Practice Solutions


