
Author David Graser, Yavapai College, Prescott, AZ (David.Graser@yc.edu)
Abstract
This project is designed to be done as a group project. Several project letters are given below. Each version has a different set of data that may be used to find a model for cost and a model for demand.
 The idea in this project is to have the teams find two models for cost (linear or quadratic) and two models for demand (linear or quadratic). Once they have these models, they use the models to come up with a corresponding revenue function and then a profit function.
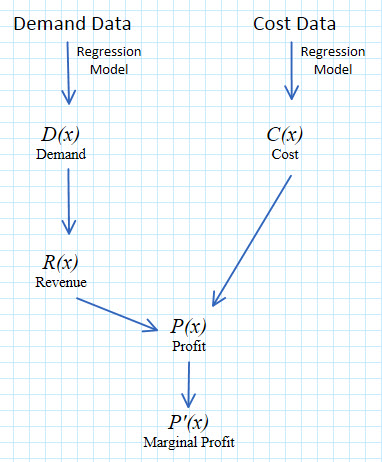
The goal is then to use this profit function to generate the marginal profit and an optimum production level for solar toasters.
- Content Area -Calculus
- Time Frame – 2 to 3 weeks with mini-lectures
- Published – June 22, 2015
- Keywords -polynomial model, cost, demand, profit, relative extrema, marginal
Project Content
- Project Letter 1 (DOCX | PDF)
- Project Letter 2 (DOCX | PDF)
- Project Letter 3 (DOCX | PDF)
- Project Letter 4 (DOCX | PDF)
- Project Letter 5 (DOCX | PDF)
- Project Letter 6 (DOCX | PDF)
- Project Letter 7 (DOCX | PDF)
- Project Letter 8 (DOCX | PDF)
- Project Letter 9 (DOCX | PDF)
Scaffolding Resources
Technology Assignment: Find Regression Models for Data
The goal of this assignment is to help teamsget started on the project. In this assignment, teams look at two different sets of data and find a linear and quadratic regression model for each set of data. Teams will use the data in the Project Letter to find regression models for the demand function and the cost function. They will work with each of these functions as functions of the number of units produced.
Teams need to assign who should do what. There are four regression models that they will need to create.
- A linear regression model of demand as a function of the number of units.
- A quadratic regression model of demand as a function of the number of units.
- A linear regression model of cost as a function of the number of units.
- A quadratic regression model of cost as a function of the number of units.
If a team has four members, each member will do one model on a separate sheet of a shared Google Sheet. If a team has fewer team members, some members may need to do more than one model. It is very important that each team get all four models in order to calculate the most appropriate profit function.
For each model, the team will need to put the appropriate data from the Project Letter into the sheet, graph it as a scatter plot, and then add the regression model.

Notes
- None