A tangent line to a function is a line that looks most like the function at a point. In common terms, it just grazes the function.
To find its equation, we need to locate the point where the two meet as well as the slope of the function at that point. Then we can use the slope-intercept form or point-slope form of a line to get the equation.
Problem Find the equation of the tangent line to
atx = 3
Solution Since this problem is asking for the equation of a line, let’s start with the point-slope form
This requires a point (x1, y1) and slope m. We’ll use the function to get the point and the derivative to get the slope of the tangent line.
Find the point: We are given a pointx = 3. To find the corresponding y value, put the x value into the function
Find the slope of the tangent line: We need h′(3) to get the slope of the tangent line. We’ll use the Power Rule to take the derivative,
The slope of the tangent is
Write the equation of the tangent line: Putting the point (3, 10) and the slope 9 into the line yields
If you are asked to write this in slope-intercept form, you’ll need to solve this for y to give
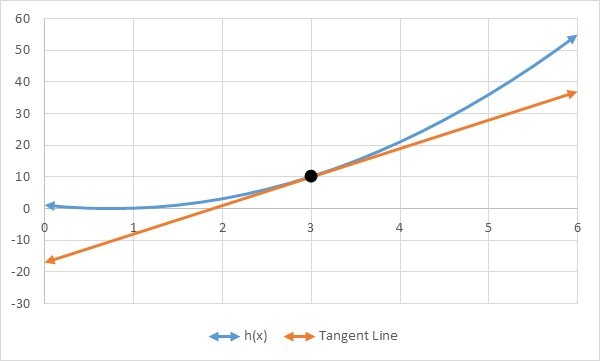
If you graph h(x) and the tangent line together, it should be obvious that your tangent line is correct (ie. tangent).
We can find the derivative of a graph of a function by drawing tangent lines on the function’s graph. In the activity below, you try this process out for yourself.
To get an idea of what we are going to try to do, read through Question 1 in Section 11.4.
Our goal in this activity is to find the slopes of tangent lines at several x values. The handout below has four pages. On the first and third pages contain the graphs along with a table of x values. Pages two and four contain empty graphs.
Print out this PDF file. To fill out the tables on pages one and three, draw tangent lines on the x values indicated in the tables. Now use the grid to estimate the slope of these tangent lines. Enter those values in the second column of the table.
Once you have filled out the table, graph the ordered pairs on the corresponding blank graph. In Example 1, you should see a very obvious pattern ( a line) to the data points you just graphed. In Example 2, there is also a pattern (a parabola) although it may not be as obvious.
Each of the ordered pairs in the table gives the derivative of the graph you took it off of. The video below illustrates this process.
This technique of drawing the derivative is not a very effective method for finding the derivative of a function. It gives us the graph, but not necessarily the formula. In the rest of Section 11.4, you’ll learn how to find the derivative using the definition with limits. You will also learn some shortcuts to take the derivative.
A tangent line to a function is a line that looks most like the function at a point. In common terms, it just grazes the function.
To find its equation, we need to locate the point where the two meet as well as the slope of the function at that point. Then we can use the slope-intercept form or point-slope form of a line to get the equation.
Find the equation of the tangent line to
at x = 3.
Since this problem is asking for the equation of a line, let’s start with the point-slope form
This requires a point (x1, y1) and slope m. We’ll use the function to get the point and the derivative to get the slope of the tangent line.
Find the point: We are given a point x = 3. To find the corresponding y value, put the x value into the function
Find the slope of the tangent line: We need h′(3) to get the slope of the tangent line. We’ll use the Power Rule to take the derivative,
The slope of the tangent is
Write the equation of the tangent line: Putting the point (3, 10) and the slope 9 into the line yields
If you are asked to write this in slope-intercept form, you’ll need to solve this for y to give
If you graph h(x) and the tangent line together, it should be obvious that your tangent line is correct (ie. tangent).