The most difficult part of finding a derivative is evaluating the limit involved in the definition of the derivative at a point. Often there is some algebra and simplifying involved as the example below demonstrates.
Problem Suppose the function g(x) is given by
Use the definition of the derivative at a point to compute g´(3).
Solution The definition of the derivative of g(x) at x = 3 is
The function value g(3) is calculated to be
The function value g(3 + h) must be calculated carefully.
Form the difference quotient and simplify:
The derivative is completed by taking the limit ash approaches zero,
The derivative of g(x) evaluated at x = 3,g´(3), is 11.
In of April 2015, the US Postal Service established new postal rates for first class mail. The postage charged for first class mail is a function of its weight. The US Postal Service uses this table to describe the rates.
Problem Convert this table to a piecewise defined function that represents first class postage for letters weighing up to 3 ounces, using x as the weight in ounces and P as the postage in cents.
Solution This one always causes many questions. I suggest trying a bunch of different inputs (weights) and seeing how it works…then try to come up with the formula.
So, I created a table of possible weights. I made sure to include weights that were fractions of an ounce (something other than 1, 2, or 3). This allows us to understand what that phrasing means.
Now let us try to add in some corresponding postage amounts. Suppose a letter weighed 0.5 ounces. It would fall into that first part of the function “First ounce or fraction of an ounce”. So it would cost 49 cents. The same would be true of a letter weighing 0.75 or 1 ounce…both would cost 49 cents. We can add some numbers to the table.
In fact, any letter weighing 1 ounce of less (and greater than 0) would cost 49 cents.
Now what happens when the letter weighs a little more than 1 ounce? For a letter weighing 1.5 ounces, the first ounce would cost 49 cents and since the letter falls into another “additional ounce or fraction of an ounce”, the total cost would be 49 + 22 = 71. Any letter weighing more than 1 ounce up to 2 ounces would have the same exact cost, 71 cents. Now we can update our table:
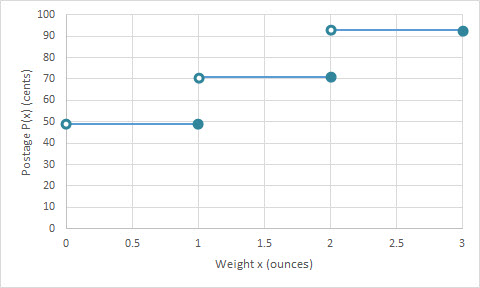
As soon as we increase the weight to the next ounce, another 22 cents is added. So a letter weighing 2.5 or 3 ounces would cost 49 + 22 + 22 = 93.
The key thing to note is that for each ounce, the postage stays constant until the next ounce. The correct piecewise function needs to take this into account.
Start your piecewise function with where the pieces are valid:
Each piece corresponds to where the postage is constant and were the rates change. For instance, at x = 1, the postage changes from 41 to 71 cents since we have gone to a new ounce. In each weight interval, the postage is constant according to the table. This give us the function
A graph of the postage function P(x) looks like the one below.
A tangent line to a function is a line that looks most like the function at a point. In common terms, it just grazes the function.
To find its equation, we need to locate the point where the two meet as well as the slope of the function at that point. Then we can use the slope-intercept form or point-slope form of a line to get the equation.
Problem Find the equation of the tangent line to
atx = 3
Solution Since this problem is asking for the equation of a line, let’s start with the point-slope form
This requires a point (x1, y1) and slope m. We’ll use the function to get the point and the derivative to get the slope of the tangent line.
Find the point: We are given a pointx = 3. To find the corresponding y value, put the x value into the function
Find the slope of the tangent line: We need h′(3) to get the slope of the tangent line. We’ll use the Power Rule to take the derivative,
The slope of the tangent is
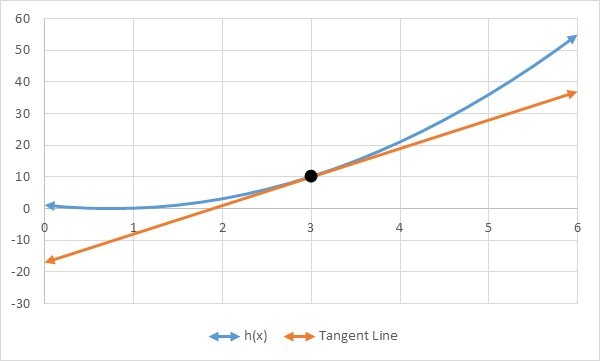
Write the equation of the tangent line: Putting the point (3, 10) and the slope 9 into the line yields
If you are asked to write this in slope-intercept form, you’ll need to solve this for y to give
If you graph h(x) and the tangent line together, it should be obvious that your tangent line is correct (ie. tangent).
Problem Evaluate the difference quotient for f (x) = x2 – 2x + 4.
This is a little different from but works the same way. Since a value is not supplied for x, we just leave it and work out the limit. Start by evaluating f (x + h):
Make sure you FOIL the square out and distribute the negative.
Now put this along with f (x) into the difference quotient.
As h gets smaller and smaller, the term in the middle gets smaller. This means the limit is equal to 2x – 2. Since the other terms do not contain x, they are unaffected when h gets small.
We can find the derivative of a graph of a function by drawing tangent lines on the function’s graph. In the activity below, you try this process out for yourself.
To get an idea of what we are going to try to do, read through Question 1 in Section 11.4.
Our goal in this activity is to find the slopes of tangent lines at several x values. The handout below has four pages. On the first and third pages contain the graphs along with a table of x values. Pages two and four contain empty graphs.
Print out this PDF file. To fill out the tables on pages one and three, draw tangent lines on the x values indicated in the tables. Now use the grid to estimate the slope of these tangent lines. Enter those values in the second column of the table.
Once you have filled out the table, graph the ordered pairs on the corresponding blank graph. In Example 1, you should see a very obvious pattern ( a line) to the data points you just graphed. In Example 2, there is also a pattern (a parabola) although it may not be as obvious.
Each of the ordered pairs in the table gives the derivative of the graph you took it off of. The video below illustrates this process.
This technique of drawing the derivative is not a very effective method for finding the derivative of a function. It gives us the graph, but not necessarily the formula. In the rest of Section 11.4, you’ll learn how to find the derivative using the definition with limits. You will also learn some shortcuts to take the derivative.

 The most difficult part of finding a derivative is evaluating the limit involved in the definition of the derivative at a point. Often there is some algebra and simplifying involved as the example below demonstrates.