Linear model are not always given in a nice slope-intercept form. If they were, it would be easy to read the slope and y-intercept off the y = mx + b form. In the example below, you are given a linear model in general form, ax + by = c. However, the letters are p and x instead of x and y.
Problem The percent p of high school seniors using marijuana daily can be related to x, the number of years after 1990, by the equation 30p – 19x = 30.
a. Find the x-intercept of the graph of this function.
Solution To find an intercept, we need to set the other variable equal to zero. In this case, to find the x-intercept, we need to set p = 0:

b. Find and interpret the p-intercept of the graph of this function.
Solution To find the p-intercept, set x = 0:
Since x corresponds to years after 1990, this tells us that in 1990 the percentage of seniors using marijuana daily was 1%.
c. Graph this function, using the intercepts. What values of x on the graph represent the years 1990 and after?
Solution Put the two points we have found on a graph.
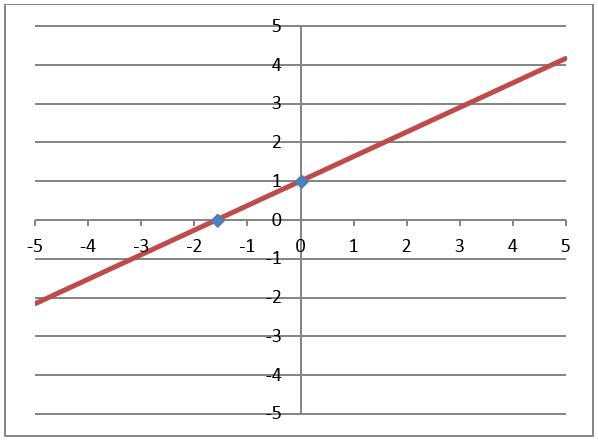 Since 1990 and beyond correspond to x values 0 and above, a better viewing window would be one like we see below.
 Notice that with each axis labeled, it makes more sense to use non-negative x values ( 0 and greater).
d. Use this model to determine the slope of the graph of this function if x is the independent variable.
Solution We could use the points we found earlier to calculate the slope, but it is easier to change the equation into slope-intercept form and read off the slope. To do this, we’ll need to solve 30p – 19x = 30 for p:
Since this is in the slope-intercept form p = mx + b, the slope is 19/30 or approximately 0.63. The line we drew above also makes sense since it has a positive slope and a vertical intercept of 1.
e. What is the rate of change of the percent of high school seniors using marijuana each year?
Solution The rate of change is the slope, with the appropriate units attached. In this case, the units are
So the percent of students using marijuana is rising at a rate of 19/30 percent per year. Since 19/30 is approximately .63, this means that each year the percentage increased by about .63%.
Interpreting this model means we examined the intercepts and their meaning as well as the slope and what it tells us about the percent using marijuana and the years since 1990.