For basic problems, a good starting point for writing out a system of equations is to define the variables. If you don’t know what the variables represent, it is almost impossible to write out the equations. Once this is accomplished, locate the different totals in the problem…these are often where the equations come from.
Problem 1 A safe investment earns 4% per year. A risky investment earns 6% per year. An investor has 20,000 dollars to invest. How much should be invested in each investment to earn 1090 dollars annually?
Solution The two totals in the problem are the total amount invested, 20,000 dollars, and the total interest earned, 1090 dollars. The 20,000 dollars total is simply the sum of the variables. To calculate interest, multiply the percentage earned times the amount.
Once the equations are written, solve them by applying the Elimination Method.
Problem 2 Coffee is usually blended before being roasted. Suppose a roaster has Guatemalan beans worth 5.50 dollars per pound and Panamanian beans worth 8.00 dollars per pound. How many pounds of each should be mixed to obtain 100 pounds of beans worth 6.25 dollars per pound?
Solution The sum of the variables is related to the total amount of beans, 100 pounds. The other total is not so obvious. Using the numbers in the problem, we can calculate the total worth of the mixture,
We can find the worth of the beans that make up the mixture by multiplying the cost per pound times the number of pounds of beans, 5.50g or 8p.
Notice that when we calculate how much 70 pounds of Guatemalan beans (385 dollars) and 30 pounds of Panamanian beans (240 dollars), the sum is 625 dollars.
Section 4.1 focused on graphing a system of inequalities to find the solution. This involved graphing each inequality and combining the graphs to find what is in common between each of the inequalities.
Although this process is a bit tedious, it is not incredibly difficult. The Application Quiz for this section focuses on the more difficult part…where does the system come from in the first place. There are a number of examples in Section 4.1 to help guide you. Let’s work through another example to augment those applications.
Problem A small brewery supplies two distributors in the Southwest US. One distributor needs at least 30 kegs each month and the other needs at least 50 kegs each month. The brewery can produce at most 100 kegs each month. Graph a system of inequalities that indicates all possible amounts that may be sent to each distributor. Label the corner points on the solution.
Solution As with all application problems, we need to start by defining the variables. What are we being asked to find? The question indicates that we are interested in “all possible amounts that may be sent to each distributor”. So define
x1: number of kegs sent to the first distributor each month
x2: number of kegs sent to the second distributor each month
Since the first distributor needs at least 30 kegs, we write down
x1> 30
The second distributor needs at least 50 kegs so we write
x2> 50
In each case, “at least” means that the variables must be larger than or equal to the number so a > is used.
The brewery can produce no more than 100 kegs per month. This means that the amount sent to distributor 1 plus the amount sent to distributor 2 must be less than or equal to 100,
x1 + x2< 100
We also know that the number of kegs must be nonnegative. However, we do not need nonnegativity constraints since the first two inequalities imply that both variables will not be negative.
Let’s write the three inequalities down.
x1> 30
x2> 50
x1 + x2< 100
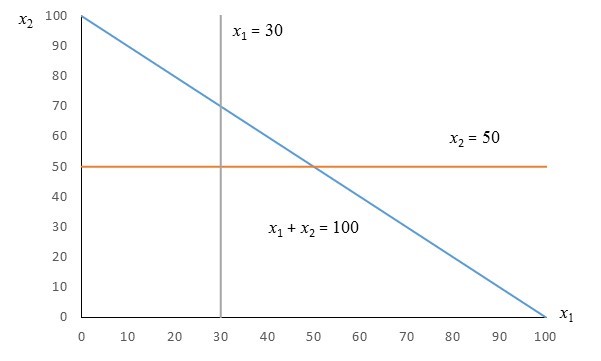
To graph the solution to this system of inequalities, let’s look at the corresponding equalities.
x1 = 30
x2 = 50
x1 + x2 = 100
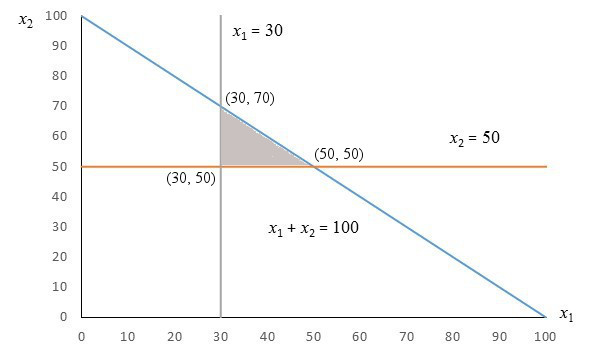
Each of these equations corresponds to a line. Let’s graph those lines with x1 on the horizontal axis and x2 on the vertical axis. There is nothing special about labeling this way. We could have also reversed the labels and solved the system.
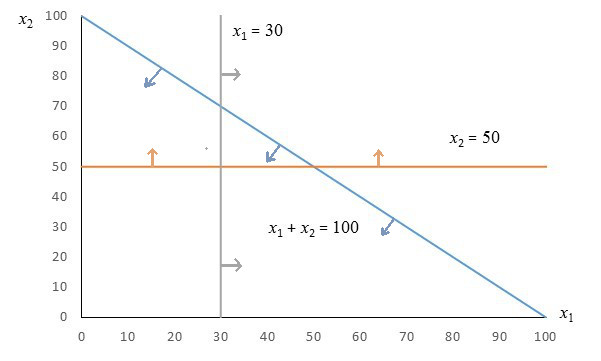
Now let’s test the point (x1, x2) = (0, 0) in each inequality.
Using this information, we can use arrows to indicate how the solutions for each individual inequality is shaded.
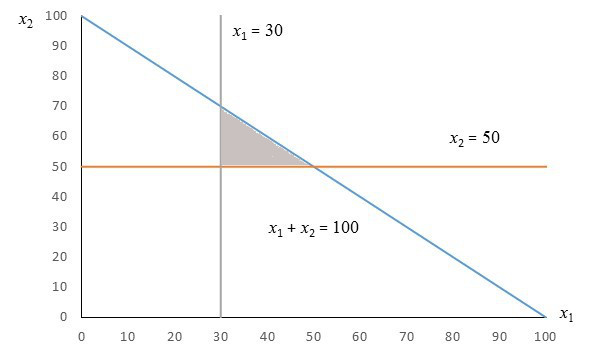
These shadings overlap in the triangular area in the center.
The solution to the system of inequalities is the shaded area. Using pairs of lines we can located the corner points.
The most challenging part of these systems of inequalities is writing them out. The key is to write out the variables explicitly. This forces you to read the problem carefully as well as look for relationships between the different quantities in the problem.
Let’s look at another example where we wish to write and graph a system of inequalities corresponding to an application.
Problem A retiree wishes to invest in bonds and stocks. He has a total of 1.2 million dollars to invest. Bonds earn an average of 3% per year and stocks return an average of 8% per year. The retiree needs at least 60,000 dollars in returns each year to live on. Graph a system of inequalities that indicates all possible amounts that may invested in bonds and stocks. Label the corner points on the solution.
Solution Since we need to find all possible amounts invested in bonds and stocks, define the variables as
B: amount invested in bonds (in millions of dollars)
S: amount invested in stocks (in millions of dollars)
The retiree has a maximum of 1.2 million. Assuming that the retiree may not invest all of the money,
B + S < 1.2 million dollars
The return on each amount if found by multiplying the rates of return by the amounts. To earn at least 60,000 dollars,
0.03B + 0.08S > 0.06 million dollars
We can also assume that both amount cannot be negative so
B > 0 S > 0
Putting these inequalities together gives the system of inequalities,
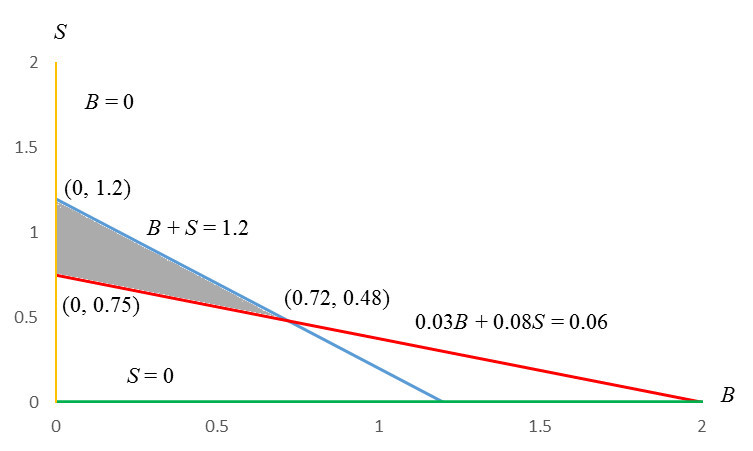
B + S < 1.2
0.03B + 0.08S > 0.06
B > 0
S > 0
Graph the corresponding system of equalities.
Since (0, 0) is on the border of the region, let’s test the point (0.1, 0.1) in each inequality.
This corresponds to the solutions indicated below.
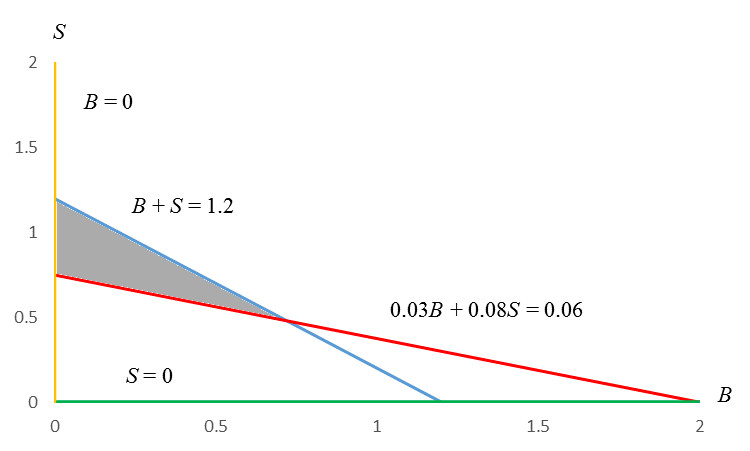
These solutions overlap in the triangular region below.
The corner points are located at the values labeled below.
Any point in the region or on its border satisfies all of the inequalities in the system. Any point along the blue border means all 1.2 million dollars will be invested. In the gray portion, only a portion is invested. However, since points inside of the region are above the red border, the retiree will earn more than 60,000 dollars in returns.
On the red border, the retiree will earn exactly 60,000 dollars, but will not invest the entire amount. At the corner point (0.72, 0.48), the investor will invest 720,000 dollars in bonds and 480,000 dollars in stocks. At this point the retiree will also have exactly 60,000 dollars in returns.
The most common mistakes in solving problems with systems of linear equations is in setting up the problem in the first place. In the example below, note how the variables are defined carefully so that the difference between amounts of money invested is distinguished from amounts of interest.
Example Katherine Chong invests 10,000 dollars received from her grandmother in three ways. With one part, she buys US savings bonds at an interest rate of 2.5% per year. She uses the second part, which amounts to twice the first, to buy mutual funds that offer a return of 6% per year. She puts the rest of the money into a money market account paying 4.5% annual interest. The first year her investments bring a return of 470 dollars. How much did she invest in each way?
Write Out The Equations
For any problem like this, we want to determine what the variables are and what they represent. Since the question asks, “How much did she invest in each way?”, let’s define
B: amount invested in bonds
F: amount invested in mutual funds
M: amount invested in money market account
How do these amounts relate to the other key totals given in the problem?
A total of 10,000 dollars invested.
The amount of invested in mutual funds is twice that invested in savings bonds.
The total return from the investments is 470 dollars.
We need to use the three facts to write out three equations in the three variables. Let’s look at each of the three facts.
A total of $10,000 invested
Since the variables represent the amounts invested, this statement simply says that the sum of the variables is 10,000 or
B + F + M = 10000
This type of fact is usually the easiest to write as an equation.
The amount of invested in mutual funds is twice that invested in savings bonds
Let’s identify the variables in this statement:
If we now translate this to a mathematical equation, we get
F = 2B
The total return from the investments is $740
To calculate the return on an investment, we need to multiply the percent return as a decimal times the amount invested at that percent. For instance, if B dollars are invested in bonds returning 2.5% per year then the amount returned from that investment in a year is .025 B. If we apply this thinking to each investment, we get that
.025B + .06F + .045M = 470
Now that we have three equations in three unknowns, let’s write out the system:
Rewrite the second equation by subtracting 2B from both sides:
Solve for Variables
We solve this system so that it looks like
where ?? are different numbers. To put in this form, we’ll utilize row operations. We’ll begin by making sure the coefficient on B in the first equation is a 1. Since it is, we do not need to use a row operation to make it so.
Now we’ll eliminate B from the second and third equations using the first equation. Use the operations
2E1 + E2 → E2
-.025E1 + E3 → E3
Let’s examine the first carefully:
Now the second operation
Writing out the operations makes them easier to check later on. Rewriting the system after these operations leaves us with
Notice that the first equation has a 1 in front of the first variable and the same variable has been eliminated from the other equations.
Now let’s make the coefficient on the second variable in the second equation equal to 1 using ⅓E2 → E2. The system is now
To eliminate F from the third equation, carry out -.035E2 + E3 → E3. Carrying out this operation gives us
Now let’s eliminate F from the first equation with -1E2 + E1 → E1 . Now the system is
Notice that these last few steps put a 1 in front of the second variable in the second equation and eliminate F in the other equations.
The last step in putting the system in echelon form is to make the coefficient on the third variable in the third equation a 1. To do this, -300E3 → E3. After multiplying the last equation, we have
Now let’s eliminate M from the first and second equation,
-⅔E3 + E2 → E2
-⅓E3 + E1 → E1
This gives
This means $2000 must be invested in bonds, $4000 in mutual funds, and $4000 in the money market account. As it should, the amounts add to $10,000 and there is twice as much in mutual funds as bonds. The total annual return is
The solution meets all of the requirements of the problem so it must be correct (unless we misinterpreted those requirements).
Note that we could solve the original system with matrices also and end up with the same solution.
What if the problem had said something like
The return on mutual funds is twice the return on savings bonds.
instead of
The amount of invested in mutual funds is twice that invested in savings bonds
Our problem above dealt with amounts invested…this new wording indicates a relationship between the returns. The rate on mutual funds is 6% so the return would be .06F. THe rate on bonds is 2.5% so the return would be .025B. Then this information is written in equation form as
.06F = 2 (.025B)
In this case, this would replace the second equation in the system.


 The most challenging part of these systems of inequalities is writing them out. The key is to write out the variables explicitly. This forces you to read the problem carefully as well as look for relationships between the different quantities in the problem.
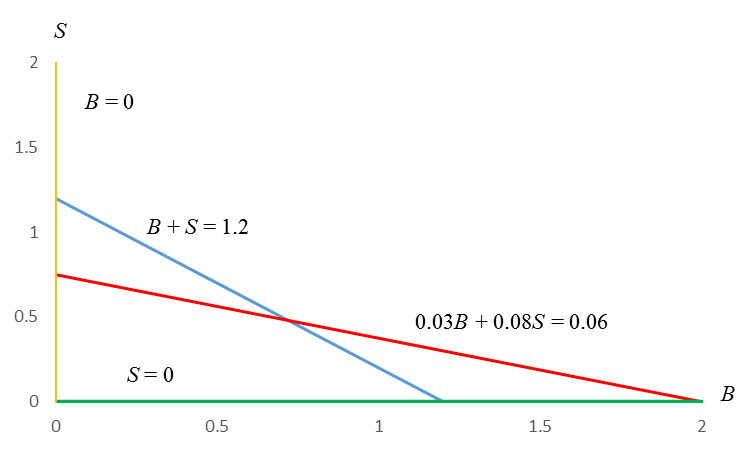


