Like other spreadsheets, Google Sheets may be used to find a regression model for data. Following a few simple steps, we can graph a set of data in a scatter plot and find the corresponding model.
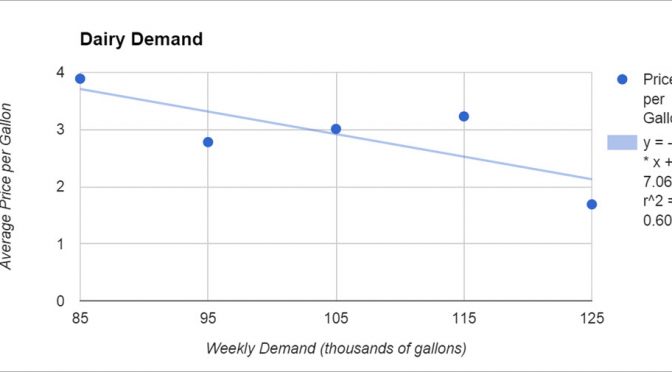
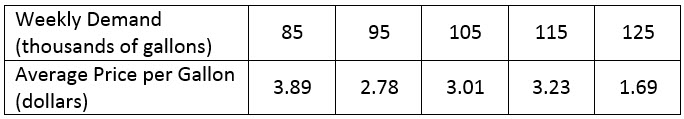
Suppose we have the demand data show in the table below.
To find a linear model for the Average Price per Gallon as a function of the Weekly Demand, we need to make a scatter plot of this data and add the linear regression model to it. Continue reading “Regression Using Google Sheets”
Historically, maximization problems have been a problem for calculus students. Not so much in finding critical points from functions and classifying them, but finding the objective function to begin with. Students rely on basic examples to mimic. We wonder why they can’t carry out more complicated examples. They are able to model simple physical situations after much practice, but flounder when faced with slightly more complicated problems because they don’t understand the complication well.
As the maximization and minimization problems become more complicated, using a table to organize examples of what is being modeled becomes more and more useful. Let’s look at another examples of how this might work.
Problem A rectangular tank with a square base, an open top, and a volume of 8788 ft3 is to be constructed of sheet metal. Find the dimensions of the tank that has the minimum surface area.
“Verizon Wireless store” by Anthony92931 – Own work. Licensed under Creative Commons Attribution-Share Alike 3.0 via Wikimedia Commons
One of my favorite activities in class involves the wireless carrier Verizon. The data for this activity comes from several years of annual reports published on the Verizon website. I have used this data in several contexts. In this post, I’ll demonstrate three of these activities. The first activity I use in the context of average rates of change. This activity is appropriate for a College Algebra or Calculus class. The second activity uses the same data in the context of marginal revenue. Finally, I’ll examine a point of inflection on the revenue at Verizon as a function of the number of wireless connections.
After weeks of linear functions, quadratic functions, and matrices, I needed an introductory example for piecewise functions. Examples like this catch student’s attention and get them thinking about how math might be used in real life. I used the example below in class and in the form you see below for my online classes.
How many of you have a car? How many of you have car insurance? In most of my classes, almost every student has a car and insurance. Yet many people are completely unfamiliar with how their insurance works and what they pay annually for that insurance.
For most people, the most important part of their insurance is the premium they pay every six months. A typical premium is $600 every 6 months. This premium may vary depending on the deductible amount. The deductible is the amount you must for a claim before the insurance company pays the rest of the claim. A higher deductible typically means a lower premium. Comparatively speaking, a lower deductible means a higher premium.


 As the maximization and minimization problems become more complicated, using a table to organize examples of what is being modeled becomes more and more useful. Let’s look at another examples of how this might work.
 Real world examples help students to see where the mathematics we teach them can be used. Let’s look at a real world example of a point of inflection.
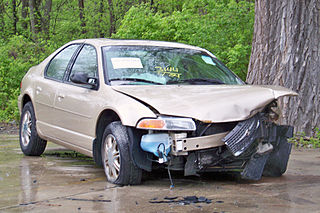 After weeks of linear functions, quadratic functions, and matrices, I needed an introductory example for piecewise functions. Examples like this catch student’s attention and get them thinking about how math might be used in real life. I used the example below in class and in the form you see below for my online classes.
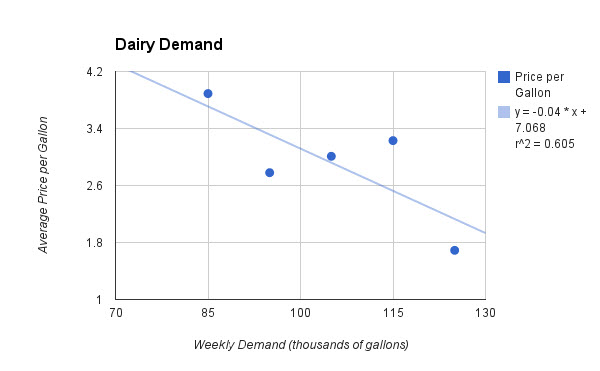