
Higher Derivatives
In popular media, you’ll often see statements describing the growth rate related to some aspect of a company’s business. For instance, in 2008 MSNBC published a story regarding how Verizon’s subscriber base was changing compared to its rival AT&T.
Verizon Wireless added 1.5 million subscribers, beating AT&T, which added 1.3 million in the quarter. However, its growth rate was down from 1.7 million in the same quarter last year. Verizon Wireless still trails AT&T in the total number of subscribers, at 67.2 million compared with 71.4 million.
Statements like these are often hard to interpret. Is the number of Verizon subscribers dropping? Or is the number of subscribers growing, but not as fast as in the past?
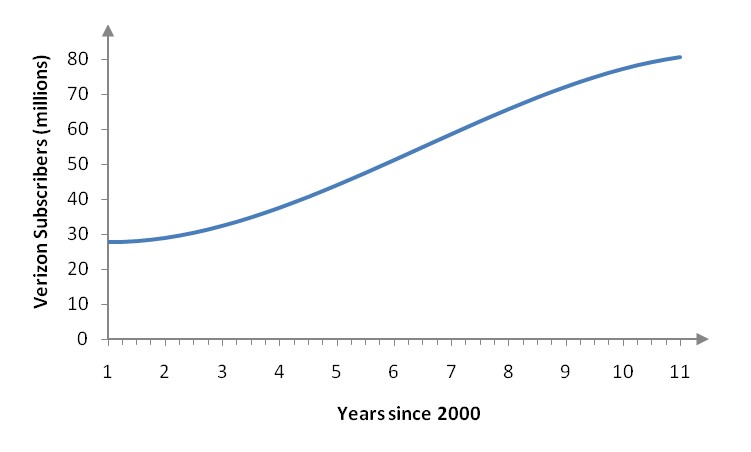
Figure 1 – The number of Verizon subscribers from 2001 through 2010.
A model of the number of subscribers as a function of time, shown in Figure 1, indicates that the number of subscribers is not dropping. But what is happening that might cause an investor to examine Verizon more closely? To answer questions like these, we need to understand how to calculate a second derivative and to understand what it tells us.
Read
- How is the second derivative calculated?
- How are other higher derivatives calculated?
- Handout: Second Derivative Example
- What does the second derivative of a function tell you about a function?
- What is the point of diminishing returns?
- Handout: Point of Diminishing Returns Example
Section 12.2 Workbook (PDF) – 9/5/19
Watch Video Playlist
