
Section 6.2 Measuring Central Tendency
A histogram gives a visual representation of data. Using a histogram, we can get an idea of where the data is centered.
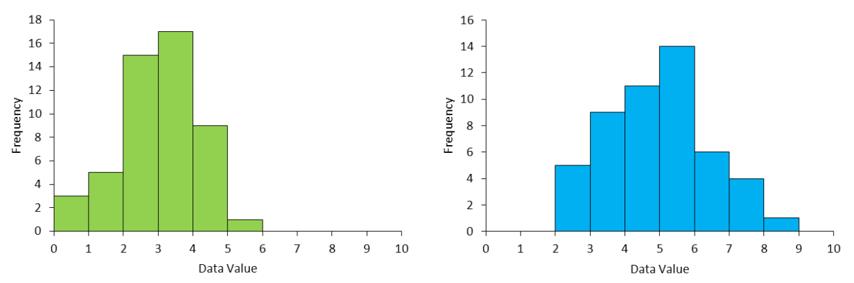
Figure 1 – The center of the data on the right is between 3 and 4. The data on the left is centered between 5 and 6.
Examining the histograms in Figure 1, we see that the data on the right is centered at values lower than the histogram on the right. This is easy to see when the histograms are placed side by side and the centers are fairly different.
We can also measure the center of the data using three different numbers. The mean, median and mode each give us a number that indicates the central tendency of the data values. In this section we’ll learn how to calculate these measures and examine their differences.
Read in Section 6.2
- What is the difference between a sample and a population?
- What is the mean of a dataset?
- What is the median of a dataset?
- What is the mode of a dataset?
Section 6.2 Workbook (PDF) – 9/4/19
Watch Video
