My son has been watching the new PBS Kids series Peg + Cat. It is essentially a math learning tool in which preschoolers learn about mathematics by discovering the meaning of the math and why it is needed. This easily keeps his attention for a half hour…not an easy task with a three-year old.
In Brain Rules, John Medina suggests that presenting the meaning of a concept before the details helps keep the attention of learners.
If the instructor presents a concept without telling the audience where the concept fits into the rest of the presentation, the audience is forced to simultaneously listen to the instructor and attempt to divine where it fits into the rest of what the instructor is saying. This is the pedagogical equivalent of trying to drive while talking on a cell phone. Because it is impossible to pay attention to ANY two things at once, this will cause a series of millisecond delays throughout the presentation. The linkages must be clearly and repetitively explained.
This really hits a mathematics teacher hard. So much of what we do in developmental math classes is details. How do you factor this polynomial? How do you find the slope of a line? How do you find find the vertex of a parabola? Without the meaning of these concepts, how can I expect to keep the attention of my students? Many textbooks present a brief introductory example to help deliver meaning. But with the amount of detail that needs to be delivered, it is way too easy for an instructor to skip the introductory example to teach the details. And then after all of the details, we expect the students to apply the details. It is not surprising that students have a hard time applying algebraic processes to solve applications.
This leads me to another quote from Medina.
How does one communicate in such a fashion that learning is improved? A simple trick involves the liberal use of relevant real-world examples embedded in the information, constantly peppering main learning points with meaningful experiences. This can be done by the learner studying after class or, better, by the teacher during the actual learning experience.
This is the key for me. I like to present real world examples as a vehicle for the details. Show them some data with a model to help motivate why certain algebraic operations are needed. In fact. many of my courses use an overlying problem to help give meaning to the content.
In College Algebra, my students complete three projects that are all related. The content of the projects is also related to their experience. The goal is to answer a simple problem. Suppose you have two options for obtaining a degree in four years.
Option A: Attend a two-year college for two years followed by two more years at a four-year college.
Option B: Attend a four-year college for all four years.
In every state in the US, the average cost of attending a two-year college is less than attending a four year college. How much would be saved with Option A over Option B from 2013 to 2017?
To answer this question, student use data from the years 2006 through 2010.
| Year | Two-Year Colleges | Four-Year Colleges |
| 2006-2007 | $2018 | $5666 |
| 2007-2008 | $2061 | $5943 |
| 2008-2009 | $2136 | $6312 |
| 2009-2010 | $2285 | $6695 |
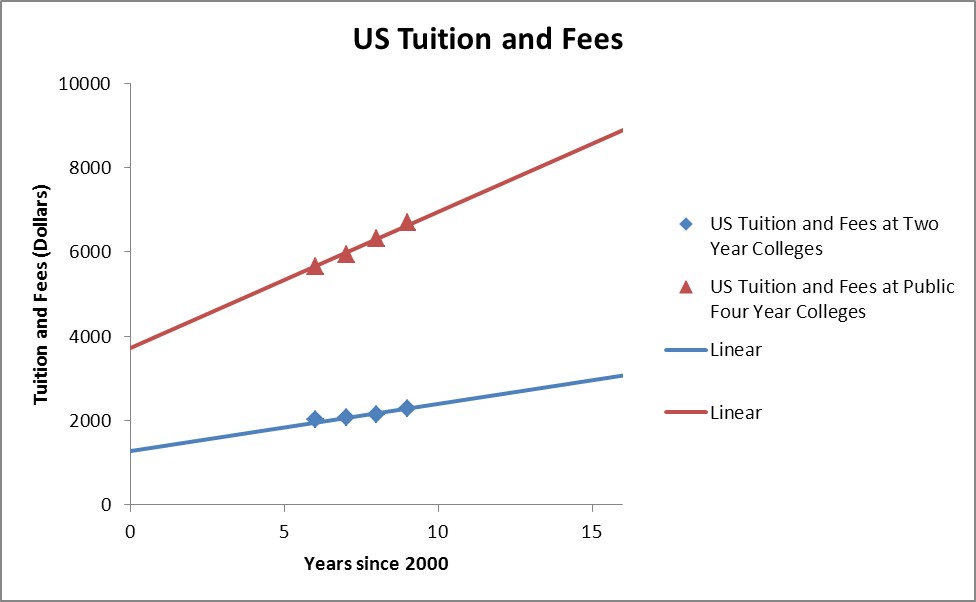
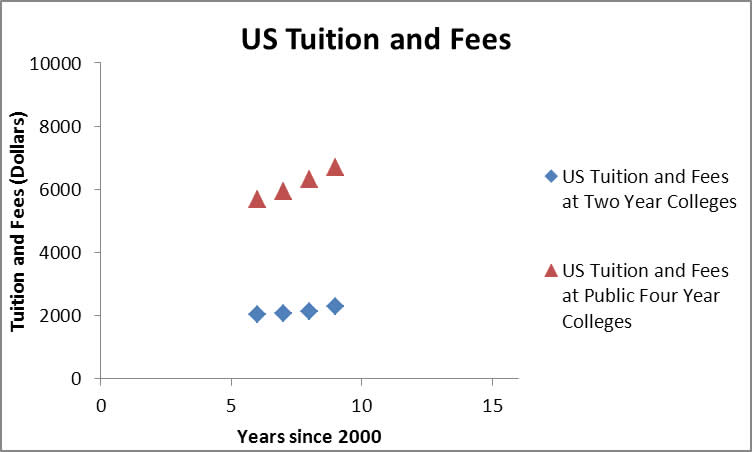
If we graph this data with time graphed horizontally and the costs vertically, we see that cost are increasing at two-year colleges and at four-year colleges.
To predict what the costs are in the future, students need to find a model for the data. In the first project, students find a linear model for each data set.

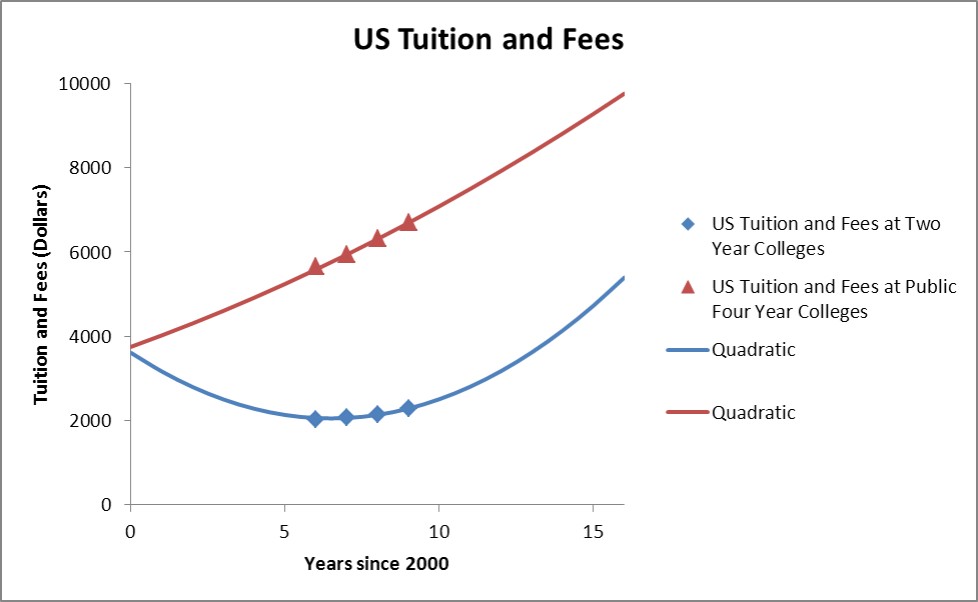
In the second project of the semester, students model the data with a quadratic function.

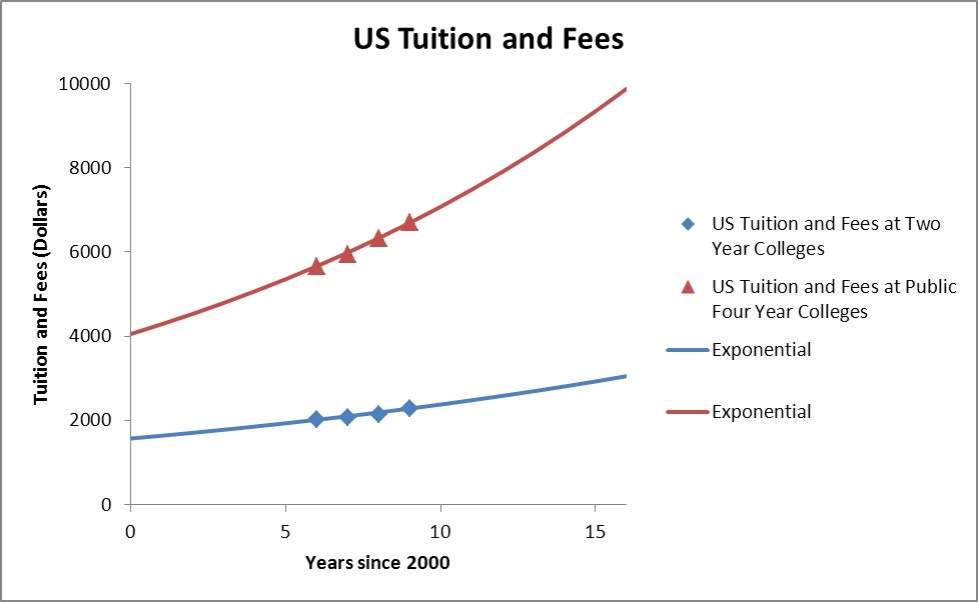
In the third project, student find an exponential model for each type of institution.

Before each project, I show these graphs to the students to help them understand what they are trying to do and why it is important. The meaning of the project is clear. By knowing the cost in the future, we can compute how much is potentially saved. All that remains is the details…how do we find these functions from the data? It is much easier to keep the attention of the students and for them to learn the details with this real-world scenario in mind.
How could you apply a real-world example to your class? What ever examples you choose, make sure you start by making sure your students understand the meaning of this example. This will make it easier to get the details across about the concepts related to the example. Throughout the details, keep referring back to the example. This keeps their attention from wandering off to wonder about how the details relate to the big picture. Their natural pattern matching abilities will also help them to connect the details back to the meaning. This will help to make the learning more substantial and permanent.

