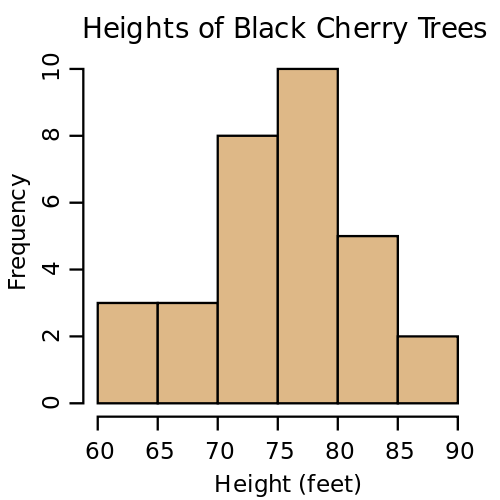
When large amounts of data are collected, we need to be able to spot trends and communicate those trends to audiences. In this section, we will look at how data may be visualized using several types of graphs.
To help us learn how to represent data visually, you will learn how to
organize data into a frequency table,
use an appropriate method to represent data visually,
compare data using stem and leaf plots.
The workbook and videos below introduce these concepts through a series of questions, guided problems and practice problems. Read through the guided problems and then complete the practice problems to help you master the objectives above.
Prior to the presidential election in 1948, numerous polls and analysts predicted that incumbent president Harry S. Truman would lose the election to Governor Thomas Dewey of New York. At the time, newspapers needed to go to press before the election was called. The Chicago Daily Tribune relied on the advice of their correspondent Arthur Sears Henning who had predicted the winners in the previous four presidential elections. Despite all of the polling indicating a Dewey presidency, Truman won the election by a narrow margin.
Statistical studies like polls rely upon smaller sets of data from samples in the hope that they reflect the statistics of a larger population. In the case of presidential polling, we hope that the preferences of Americans polled reflect the preferences of Americans who vote in the election.
In this section we will examine how a population is sampled to make sure the sample is not biased. In other words, we want this statistics of the sample to reflect the statistics of the corresponding population. You will learn to
identify the type of sampling used in a statistical study,
identify potential sources of bias in a statistical study
Use the workbook and videos below to learn about sampling and bias. Make sure you work through the guided examples and the corresponding practice problems.
In this module we’ll look at how mathematics can be used in different consumer math applications. All of these applications involve percents and interest. Interest is money paid to a lender or borrower as a cost of using money. A borrower pays interest to a lender for the use of money. A bank pays interest to a depositor as compensation for the bank using their money. We will start by examining how percents work and then use that knowledge to compare simple interest to compound interest.
Interest is an important part of financial transactions. You pay interest when you borrow money by using your credit card or taking out a loan for a car or home. You earn interest when you save money for retirement in an annuity. In the last three sections of this module, we’ll look at how these transactions work.
Our goal in this module is
Apply the mathematics of personal finance, including compound interest, annuities, and amortized loans.
The section below will help you to master this goal.
In this module, we’ll look at different ways a quantity can increase and decrease. Throughout this module we’ll explore linear, quadratic, and exponential growth and decay.
Linear growth is very common in many occupations. In fact, salaries may be specified as a constant annual increase. This is an example of linear growth. The cellular provider Google Fi has a basic plan that charges $20 per month and $10 per gigabyte of data. These costs can also be thought of as linear growth. The distance a falling stone travels over time increases quadratically.
The number of cells in a petri dish may grow faster and faster if they are properly nourished. This type of growth is called exponential growth. You may be familiar with this term. But be cautious, the term “exponential” is often misused and used to describe any type of growth.
Our goal for this module is to create and apply linear, quadratic and exponential models for applications like the ones above.
Many professions require practitioners to work with measurements. Whether you are a carpenter, mechanic, or nurse, you may need to measure quantities like distance, volume, and time. Different systems of measurement are used for each of these quantities. Within each system, different types of units are used. The most common units used are metric units.
For instance, cubic centimeters (cc’s) or milliliters are a volume measurement that might be used to describe an amount of drug solution administered to a patient. A pill might be administer in milligrams. The dosage might be specified as an amount per kilogram of patient weight.
Syringe with a scale in milliliters.
Proper dosing requires knowledge of the metric system and conversion between different units of measurement. In this short chapter, you will learn to
Use dimensional analysis to make conversions with metric and U.S. measurement systems.
Skill in converting measurements is critical in many professions and this chapter will help you to gain these skills.