Cornischong at Luxembourgish Wikipedia [CC BY-SA (https://creativecommons.org/licenses/by-sa/1.0)]
Games of chance are examples of experiments where the outcomes are uncertain. In poker, there are millions of different ways a five card hand can be dealt. However, only one of these hands correspond to a club royal flush. This makes the likelihood of being dealt a club royal flush extremely unlikely. probability is a way of quantifying the likelihood of this hand occurring.
In this chapter, we’ll learn how to calculate probabilities. This will require you to learn a number of basic principles about what probability is and the difference between theoretical and empirical probability. This will help you to master two more learning outcomes in the class.
Perform the basic operations of “or”, “and”, and complement on sets.
Evaluate probabilities of simple, compound, independent and dependent events.
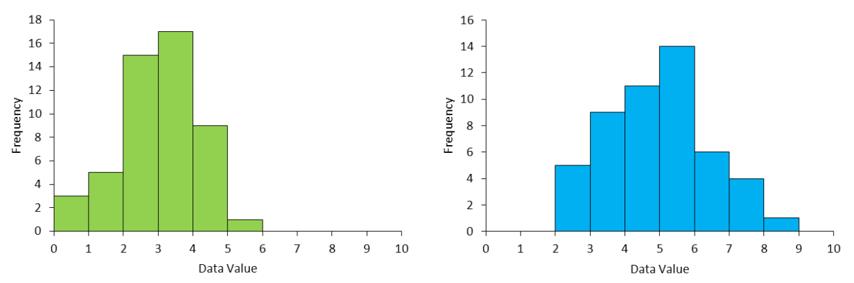
In section 6.2, we focused on the central tendency of a dataset. In this section, we’ll examine how spread out the data is. On a histogram, the spread of the data is easy to notice.
Figure 1 – The data in the histogram on the right is more spread out from its center than the histogram on the left.
Examining the histograms in Figure 1, we see the data values fall between 0 and 6 on the left. The data fall between 2 and 9 on the right indicating a slightly wider spread.
In this section, we’ll calculate several measures that indicate the spread of the data.
A histogram gives a visual representation of data. Using a histogram, we can get an idea of where the data is centered.
Figure 1 – The center of the data on the right is between 3 and 4. The data on the left is centered between 5 and 6.
Examining the histograms in Figure 1, we see that the data on the right is centered at values lower than the histogram on the right. This is easy to see when the histograms are placed side by side and the centers are fairly different.
We can also measure the center of the data using three different numbers. The mean, median and mode each give us a number that indicates the central tendency of the data values. In this section we’ll learn how to calculate these measures and examine their differences.
When you operate a business, the more you know about your customer, the better you can serve that customer. For this reason, companies like Target, Amazon, and Google collect as much information as possible about their customers. This information, called data, might include a list of all of your purchases, your gender, your age, or your most recent Internet search results. A business will conduct experiments to collect data. An experiment is any process that results in some type of data. These companies monitor your purchases using loyalty cards or from your online behavior.
Statistics are used to turn this data into charts, graphs, and numerical measures. These items are used to make decisions about the business or to market to the customer better. Studies have shown that the earlier a company attracts a customer, the more loyal that customer will be in the future. Target is able to determine when a customer is pregnant based on their purchases. They can tell whether the customer is pregnant or whether they are simply making purchases for another person. With this knowledge, they are able to customize the offers and coupons made to the expectant mother. Often they are able to do this even before the expectant mother has disclosed their pregnancy to any other person. By securing the loyalty of the mother, they are able to increase sales to the mother and to her children in the future.
In this section, we’ll examine several different datasets. Since some of these datasets may be quite length, you’ll learn how to use table and charts to summarize the data. This makes the data easier to understand and utilize to make decisions.
Today the world is dominated by huge amounts of data. To organize that data, we need to be able to represent it in some meaningful way. In this chapter we’ll look at some simple ways to represent data graphically. once we have done that, we’ll examine different ways we can summarize data numerically. This will help us to master the learning outcome
Compute measures of central tendency and dispersion for a collection of statistical data.