In Chapter 1, we looked at several applications of linear functions. One set of linear functions was the cost and revenue functions for a dairy. These functions can be analyzed to determine when the dairy farm is making money and when it is losing money. The break-even point is the point at which a farm’s costs are equal to its revenue. In this section we’ll learn how to find this point graphically.
We also looked at supply and demand functions for milk. These functions model the consumer’s and supplier’s behavior with respect to the quantity and price of milk in a market. In economics, we are interested in knowing how the quantity of milk sold is related to the price of milk. The equilibrium point describes the price of a commodity, such as milk, when the quantity demanded by consumers matches the supply that manufacturers are willing to provide. In this section we’ll locate the equilibrium point graphically.
For both of these applications, we need to find a point of intersection of two lines. Many other applications require the same mathematical process. At the end of this section we’ll build an application from the ground up. In this application, we’ll learn how different types of gasoline containing ethanol can be blended together to yield a mixture with a particular volume and level of ethanol.
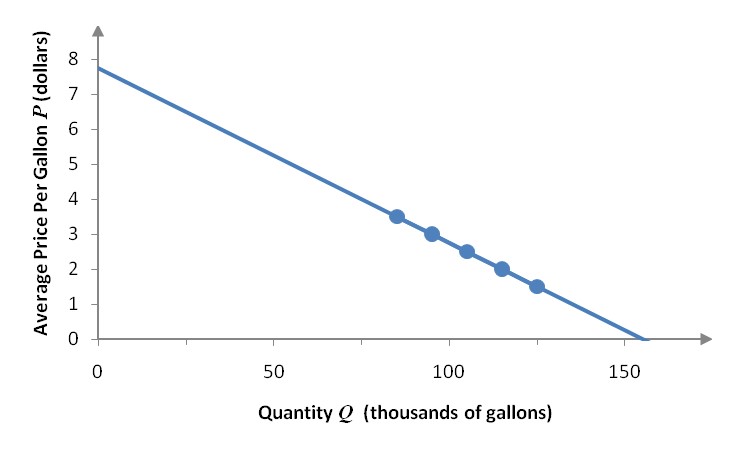
In section 1.2, we found the demand function D(Q) for a dairy. The scatter plot and corresponding linear function are pictured in Figure 1.
Figure 1 – The demand function D(Q) = -0.05Q + 7.75 for the data in Example 7 of section 1.2.
In this scatter plot, the function passes through each point perfectly. In other words, the prices at each quantity in the data match the prices from the function at the corresponding prices. This occurred because the slopes between adjacent ordered pairs were exactly the same. In this section we’ll find linear models for data that do not lie along a straight line.
Linear functions are prevalent throughout business and economics. They provide a simple way to model economic quantities. Even if a linear function is not the best type of function to model a quantity, often they are used as an initial model to help understand a situation and all of its complexities. In this section we’ll look at a number of different situations in which a linear model might be appropriate. In later chapters we’ll revisit these applications and modify them as needed to account for properties which linear models don’t provide.
Linear functions are composed of two pieces separated by addition or subtraction. Each of these pieces is called a term. We’ll start this section by examining how we can determine what these terms tell us about the function. Once we understand how to find the terms, we’ll look at some specific examples of linear functions in business. The first linear function we’ll examine is a linear cost function. In section 1.1 we looked at some examples of linear cost functions to help us understand variables and function notation. In this section we’ll look at the individual pieces of a linear cost function to see what they represent in business. Then we’ll conclude this section with several more examples of linear functions. Each of these examples will help to model milk production at a dairy.
A linear function is one of the simplest functions that we can use to model quantities in finance, economics, and accounting. Although many applications are very complex and call for functions that are also fairly complicated, linear functions are used because of their simplicity and ease of use. Despite this, modeling with linear function often retains the essence of the problem and allow us to understand concepts in a concrete manner.
Before we can examine linear functions, we need to understand the role of independent and dependent variables. Once we understand variables, we can use them to define linear functions.