
 Problems in which you select members for a committee can involve combinations, permutations or both. This MathFAQ examines several similar problems that help to distinguish between permutations and combinations.
Technology Can Be Deceiving…
Suppose you are asked to determine whether a function is discontinuous. Many of you might use technology to help you graph a function to decide what the limits are from the left and right. Remember, a function is continuous at a point if the limits from the left and right are equal and also match the value of the function at the point.
Be aware that the TI calculators, WolframAlpha, and Desmos may give slightly different graphs and lead you to the wrong conclusion.
The new MathFAQ below demonstrates how to graph
in WolframAlpha and Desmos.
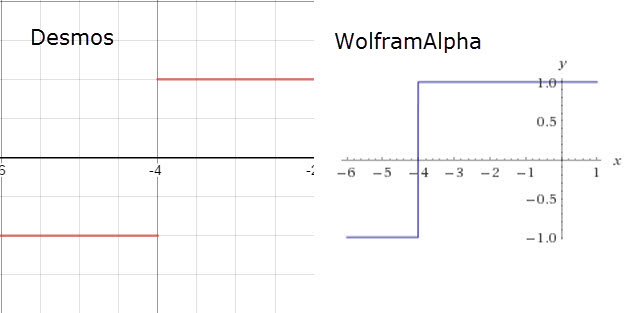
Notice how the graphs differ. Which one is the better graph to use if you are deciding if the function is discontinuous?
How Do You Write Out The Solutions To A Dependent System of Linear Equations?
Dependent systems of equations are systems of equations that have many solutions. Typically when you solve a dependent system with substitution or elimination, you get 0 = 0. This indicates that many combinations of x and y will solve the system of equations…but how do you find those ordered pairs?
In the MathFAQ below, I demonstrate two strategies for writing out the solutions to dependent systems of linear equations.
Piecewise Functions and US Postage

Postage on first class mail in the United States is based on weight. Each ounce is charged according to a table published by the US Postal Service. The FAQ below shows how to take this table and write out a piecewise function P(x), where x is the weight of the letter.
How Do I Do Linear Regression in Google Sheets?

Like other spreadsheets, Google Sheets may be used to find a regression model for data. Following a few simple steps, we can graph a set of data in a scatter plot and find the corresponding model.