In popular media, you’ll often see statements describing the growth rate related to some aspect of a company’s business. For instance, in 2008 MSNBC published a story regarding how Verizon’s subscriber base was changing compared to its rival AT&T.
Verizon Wireless added 1.5 million subscribers, beating AT&T, which added 1.3 million in the quarter. However, its growth rate was down from 1.7 million in the same quarter last year. Verizon Wireless still trails AT&T in the total number of subscribers, at 67.2 million compared with 71.4 million.
Statements like these are often hard to interpret. Is the number of Verizon subscribers dropping? Or is the number of subscribers growing, but not as fast as in the past?
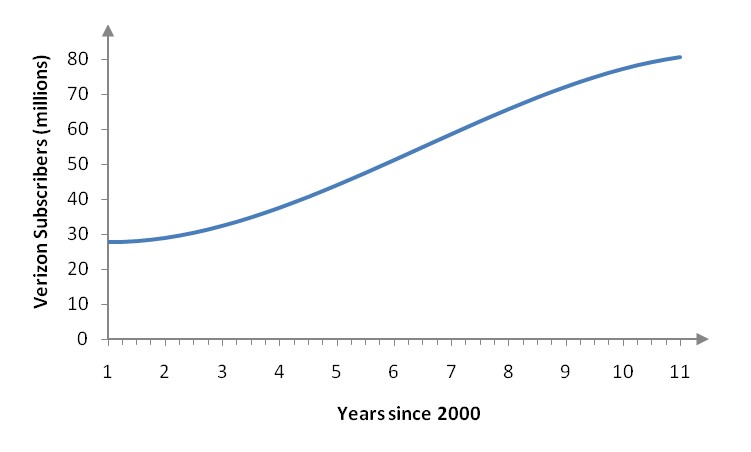
Figure 1 – The number of Verizon subscribers from 2001 through 2010.
A model of the number of subscribers as a function of time, shown in Figure 1, indicates that the number of subscribers is not dropping. But what is happening that might cause an investor to examine Verizon more closely? To answer questions like these, we need to understand how to calculate a second derivative and to understand what it tells us.
This module is based on Chapter 12 in the textbook. Each section includes a workbook and the answer to the practice exercises are available below.
In the last chapter, you learned how to measure change using derivatives. Now that you know how to take a derivative and interpret the results, we want to be able to apply derivative to solving more business problems.
We’ll start out this module by tracking the sign of the derivative. This will help us to determine when he function is increasing and when it is decreasing. When the derivative is positive, the tangent line has a positive slope and the function is increasing. A negative derivative means the slope of the tangent line is negative so the function must be decreasing.
At the end of the module, we’ll analyze business functions such as profit, revenue and average cost. This will help us to determine the production level that maximizes profit or revenue and the production level that minimizes average cost.
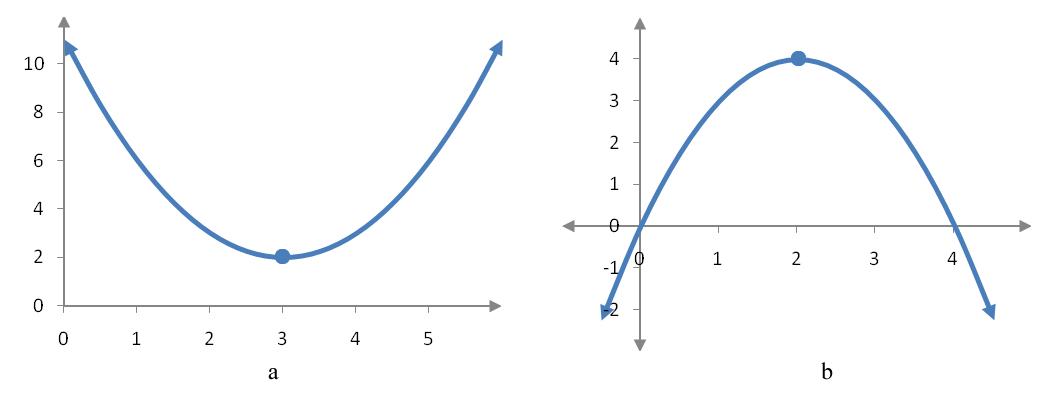
The graph of a function may rise and fall resulting in relative and absolute extrema. For instance, if a continuous function falls and then rises as we move from left to right on its graph then we can deduce that the function must have a relative minimum.
Figure 4 – When a function falls and then rises, we get a relative minimum as in (a). In (b), the function rises and then falls resulting in a relative maximum.
A continuous function that rises on the left and then drops on the right has a relative maximum. The terms increasing and decreasing are used to describe when a function is rising or falling as we move from the left to the right on the graph of a function.
Suppose x1 and x2 are two numbers in an interval over which a function f is defined.
f is increasing on the interval if f (x1) < f (x2) whenever x1 < x2.
f is decreasing on the interval if f (x1) > f (x2) whenever x1 < x2 .
Figure 5 – In (a), function values on the right are higher than function values on the left so the function is increasing. In (b), function values on the right are smaller than function values on the left so the function is decreasing.
Critical points are ordered pairs on the graph where the function can potentially change from increasing to decreasing or decreasing to increasing. This means that we will be able to use these critical numbers to find the relative extrema of a function later in this section.
Let f be a continuous function defined on an open interval containing a number c. The number c is critical value (or critical number) if f ′(c) = 0 or f ′(c) is undefined. A critical point on the graph of f has the form (c, f (c)).
When necessary, we’ll use the term stationary value to indicate critical values where the derivative is equal to zero and the term singular value to indicate critical values where the derivative is undefined.
We can test the derivative of a function at test values between the critical values to find the sign of the slope of the tangent line at the test values. This allows us to deduce whether the function is increasing or decreasing between the critical values.
Test for Determining the Intervals Where a Function is Increasing or Decreasing
Suppose a function f is defined on an open interval and that we are able to compute the derivative of the function at each point in the open interval.
If f ′(x) > 0 at every x value in the interval, then f is increasing on the interval.
If f ′(x) < 0 at every x value in the interval, then f is decreasing on the interval.
If f ′(x) = 0 at every x value in the interval, then f is constant on the interval.
Using this test, we can write down a strategy for finding all intervals where a function is increasing or decreasing.
Strategy for Tracking the Sign of the Derivative
Take the derivative of the function and use it to find all of the critical values. Below a number line, label these values. Above the number line, write = 0 to indicate critical values where the derivative is zero or write “und” to indicate critical values where the derivative is undefined. The open intervals between these values are where we will determine the sign of the derivative.
Pick a value in each of the open intervals between the critical values. Substitute these values in f ′(x) to determine whether the derivative is positive or negative at these values. Label the number line + or – to indicate whether the derivative is positive or negative.
The function is increasing over the intervals where f ′(x) > 0 and decreasing over the intervals where f ′(x) < 0.
Example 5 Find Where a Function is Increasing and Decreasing
Let
Use the derivative of this function to answer the questions below.
a. Find the derivative of f (x).
Solution The derivative is found by applying several derivative rules,
So the derivative of f (x) is
b. Use the derivative to find the critical values of f (x).
Solution The critical values of f (x) are where f ′(x) is equal to zero or undefined. Since f (x) is a polynomial, it is defined everywhere. All critical values are where f ′(x). Set the derivative equal to zero and solve for x to find these points,
The critical values are x = 0, 3 and -3.
c. Find the intervals where f (x) is increasing and the intervals where f (x) is decreasing.
Solution A function is increasing when the derivative of the function is positive and decreasing when the derivative of the function is negative. Make a number line and place the critical numbers on the number line. Above each critical number place the value of the derivative, either equal to zero or undefined.
These three critical numbers divide the number line into four sections: (-∞,-3), (-3, 0), (0, 3) and (3, ∞). In each of these intervals, the graph is either increasing or decreasing. The critical numbers are where the graph could potentially change from increasing to decreasing of vice versa.
To decide where the graph is increasing or decreasing, we need to pick a test point from each interval and use it to determine the sign of the derivative at the test point. Although we can test the point in the derivative above, it is easier to use the factored form of the derivative
For instance, the test point x = -4 is in the interval (-∞,-3). If we substitute this value into the derivative we get
This tells us the function’s graph is decreasing in the interval (-∞,-3). To find where the graph is increasing, we need to test the derivative in each of the other intervals (-3, 0), (0, 3) and (3, ∞).
To simplify the testing of the derivative, we need to realize that we only need to know the sign of the derivative, not the actual value. If we substitute the value x = -4 into the derivative and note the sign of each factor, we can quickly determine the sign of the product of the factors:
A simple way to symbolize this result is to label the signs of the factors on the number line.
The product of three negative factors is negative so we know the function is decreasing in the interval (-∞,-3).
Let’s examine the test point x =-1 in the interval (-3, 0). When we examine the signs of the factors in the derivative at this value,
Label these signs above the interval on the number line:
The product of two negative numbers and a positive number is positive so the graph is increasing in the interval (-3, 0).
If we continue testing and labeling the first derivative number line, we see exactly where the first derivative is positive and negative.
Based on this number line, the derivative is positive in the intervals and . This means the graph of the function is increasing in the intervals (-3, 0) and (3, ∞).
With the number line labeled like this we can also observe that the graph is decreasing in the intervals (-∞, -3) and (0, 3).
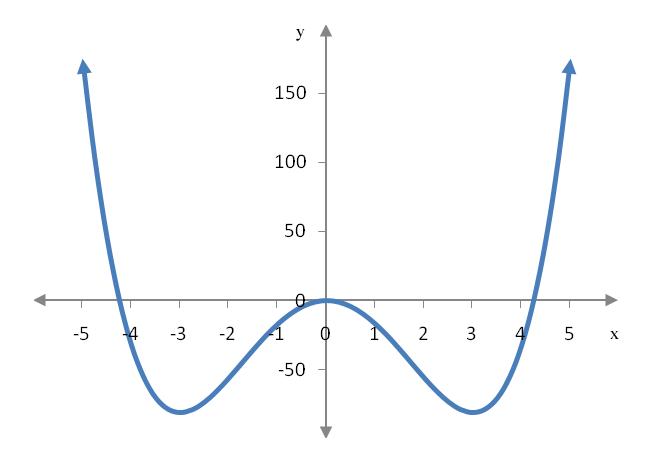
We can check this number line by examining the graph of the function.
From the graph we can verify that the function increases on (-3, 0) and (3, ∞). It also decreases on (-∞, -3) and (0, 3). We should be cautious when using the graph as our only evidence of where the graph is increasing or decreasing. We can only read approximate values from the graph. The derivative allows us to find the intervals exactly.
How do you find the absolute extrema of a function?
The absolute extrema of a function is the highest or lowest point over which a function is defined. In general, a function may or may not have an absolute maximum or absolute minimum. However, under certain conditions a function will automatically have absolute extrema. The Extreme Value Theorem guarantees that a continuous function defined over a closed interval will have both an absolute maximum and an absolute minimum. These extrema will occur at the critical values or at the end points on the closed interval.
To find the absolute extrema from these possibilities, we must determine which of these values yields the highest and lowest values of the function. This is done by testing each critical value and the endpoints in the function. The highest value of the function is the absolute maximum and the lowest value is the absolute minimum.
Strategy for Finding Absolute Extrema
To find the absolute extrema on a continuous function f defined over a closed interval,
Find all critical values for the function f on the open interval.
Evaluate each critical value in the function f.
Evaluate each endpoint of the closed interval in the function f.
The largest function value from steps 2 and 3 is the absolute maximum and the smallest function value from steps 2 and 3 is the absolute minimum.
Notice that the absolute extrema are the function values, not the critical values or endpoints. However, the absolute extrema occur at points on the graph given by an ordered pair.
Example 9 Find the Absolute Extrema of a Function
Find the absolute maximum and absolute minimum of the function
on the closed interval [1, 6].
Solution This function is a polynomial so it is continuous not only on the closed interval [1, 6], but everywhere. The absolute extrema of a continuous function over a closed interval will occur at a critical value in the interval or at the endpoints. We can located the critical values of this function from the derivative,
Since f (x) is a polynomial and defined everywhere, the only critical values are due to where the derivative is equal to zero. Set f ′(x) equal to zero and solve for x:
One of these critical values, x = 0, is not in the interval so we can ignore it.
The other critical point at x = 4 and endpoints at x = 1 and x = 6 are substituted into f (x) in order to find the highest and lowest points on the graph.
The absolute maximum occurs at (4, 128/3) since it has the largest y value. The absolute minimum occurs at (6, 0) since it has the smallest y value.
Example 10 Find the Absolute Extrema of a Function
Find the absolute maximum and absolute minimum of the function
on the closed interval [2, 10].
Solution The natural logarithm is continuous over [2, 10] and the denominator is equal to zero outside of this interval. This means the quotient is continuous over [2, 10]. Therefore the absolute extrema are located at the critical values or the endpoints of the interval. To find the critical values, calculate the derivative with the quotient rule.
The numerator, denominator and their derivatives are
The derivative is
The critical values of a function are where the derivative is equal to zero or undefined. For a fraction like this one, the derivative is undefined where the denominator is equal to zero. This occurs when x = 0 . However, this value is outside of the interval [2, 10] so it can be ignored.
To find where the derivative is equal to zero, set the numerator of f ′(x) equal to zero and solve for x:
This critical value is at x = e. This value is approximately 2.72 and is in the interval [2,10].
To find the absolute extrema, we need to substitute the critical value at x = e and the endpoints of the interval at x = 2 and 10 into f (x).
Using the function f (x), we get the location of each ordered pair at the critical number and endpoints.
The absolute maximum occurs at approximately (e, 0.37) and the absolute minimum occurs at approximately (10, 0.23).
Example 11 Find the Absolute Extrema of a Function
Verizon Wireless charges each customer a monthly charge for service on its wireless network. This charge is recorded as service revenue in corporate reports. The average annual service revenue per customer (in dollars) at Verizon Wireless from 2004 to 2009 can be modeled by the function
where t is the number of years since 2000.
(Source Verizon Annual Reports 2004 through 2009)
a. Over the period 2004 to 2009, when was the average annual service revenue per customer highest?
Solution Since this function is defined from 2004 to 2009, the variable t is defined on the closed interval [4, 9]. The average annual service revenue per customer is highest at the absolute maximum on this interval.
The derivative of R(t) is found using the basic rules for taking derivatives and the Power Rule for Derivatives:
Critical values for this polynomial are found by setting this derivative equal to zero and solving for the variable:
Both of these critical values are in the interval [4, 9].
Evaluate R(t) at the two critical values and the endpoints to find the absolute maximum.
The average annual service revenue per customer is highest at t ≈ 8.34 or in the year 2008.
b. When the average annual service revenue per customer was highest, how much was each customer paying each month?
Solution The average annual service revenue per customer was highest at t ≈ 8.34 at a value of 594.39 dollars per customer. However, this is the annual service revenue per customer. To get the monthly service revenue per customer at this time, divide this value by 12 to give
How do you find the relative extrema of a function?
The strategy for tracking the sign of the derivative is useful for more than determining where a function is increasing or decreasing. It is also useful for locating the relative extrema of a function. At a relative extrema, a function changes from increasing to decreasing or decreasing to increasing. The number lines in the previous question allow us to see these changes by observing changes in the sign of the derivative of a function.
When the derivative of a function changes from positive to negative, we know the function changes from increasing to decreasing. As long as the function is defined at the critical value where the change occurs, the critical point must be a relative maximum. If the derivative of a function changes from negative to positive, we know the function changes from decreasing to increasing. In this case, the critical point is a relative minimum as long as the function is defined there. If the derivative does not change sign at a critical value, there is no relative extrema at the corresponding critical point.
The First Derivative Test summarizes these observations and helps us to locate relative extrema on a function.
First Derivative Test
Let f be a non-constant function that is defined at a critical value x = c.
If f ′ changes from positive to negative at x = c, then a relative maximum occurs at the critical point .
If f ′ changes from negative to positive at x = c, then a relative minimum occurs at the critical point .
If f ′ does not change sign at x = c, then there is no relative extrema at the corresponding critical point.
Example 6 Find the Relative Extrema of a Function
Find the location of the relative extrema of the function
Use Sum / Difference Rule and the Product with a Constant Rule.
Solution The first derivative test requires us to construct a number line for the derivative so that we can identify where the graph is increasing and decreasing. Using the rules for derivatives, the first derivative of the function f (x) is
So the derivative is
We need to use this derivative to find the critical values. Set the derivative equal to zero to find those values.
In general, critical values may also come from x values where the derivative is undefined. Since f ′(x) is a polynomial, it is defined everywhere so the derivative is defined everywhere.
Although this derivative could be factored to find the critical values, most quadratic derivatives are not factorable. In this case, the quadratic equation yielding the critical values can be solved using the quadratic formula. This strategy would yield the same critical values as factoring:
To find the critical values with more complicated derivatives, we may need to solve the equation 12x2 – 48x + 18 = 0 using a graph. The solution to the equation can also be found by locating the x intercepts on the derivative.
Like factoring or the quadratic formula, the critical values are located at x = 1⁄2 and x = 3. All three strategies yield the same critical values. Keep in mind that a graph will give approximate values while factoring or the quadratic formula yield exact values.
If the derivative is not factorable, linear, or quadratic, another method will need to be used to determine where the derivative is equal to zero. Even though a graph of the derivative only gives an estimate of the critical values, it may be the only way to find the critical values if the derivative is complicated.
With the critical values in hand, label them on a number line so that we are able to apply the first derivative test.
If we select a test point in each interval and determine the sign of each factor, we can complete the number line and track the sign of the derivative.
When a continuous function changes from increasing to decreasing, we have a relative maximum at the critical value. When a continuous function changes from decreasing to increasing, we have a relative minimum at the critical value. In this case, the relative maximum is located at x = 1⁄2 and the relative minimum is located at x = 3.
To find the ordered pairs for the relative extrema, we need to substitute the critical values into the original function to find the corresponding y values:
The relative maximum is located at (1⁄2, 37⁄4) and the relative minimum is located at (3, -22).
Example 7 Find the Relative Maximum
Find the location of the relative maximum of the function
Solution The derivative of is found with the Quotient Rule for Derivatives with
Put these expressions into the Quotient Rule:
To make it easier to find the critical values, simplify the derivative.
Now we can find the critical values by determining where this fraction is equal to zero or undefined.
Any fraction is equal to zero where the numerator is equal to zero. In this case, this is where 1 – x = 0 or x = 1. Fractions are undefined where the denominator is equal to zero. The denominator for this fraction is ex and is always positive so there are no x values where the fraction is undefined.
To apply the first derivative test, label a number line with this critical value and test the first derivative on either side of the critical value:
Since this function is continuous and the derivative changes from increasing to decreasing at x = 1, the critical point is a relative maximum. The y value for the relative maximum comes from the function g(x) and is
The ordered pair for the relative maximum is (1, 1⁄e).
Example 8 Find the Minimum Average Cost
The total daily cost to produce Q units of a product is given by the function
The average cost function C(Q) is found by dividing the total daily cost function C(Q) by the quantity Q.
a. Find the average cost function C(Q).
Solution The average cost function is defined by
Substitute the total daily cost function into the numerator of this fraction to yield
b. Find the quantity that yields the minimum average cost.
Solution The minimum average cost is found by locating the relative minimum of the average cost function. To use the first derivative test to find this relative minimum, we need to take the derivative of C(Q) using the Quotient Rule for Derivatives. The numerator, denominator and their derivatives are
The derivative of the average cost function is
Since we need to use the derivative to find the critical values, we simplify the derivative as much as possible:
Any fraction is equal to zero when the numerator is equal to zero and undefined where the denominator is equal to zero.
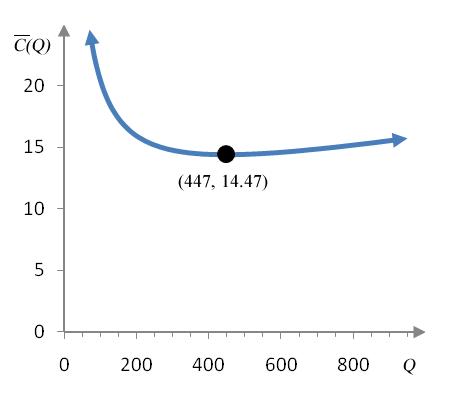
Since quantities produced must be positive, only Q ≈ 447 is a reasonable critical value for this function.
The number line for this function only includes positive quantities. Testing on either side of the critical numbers yields the behavior of C′.
Since the function decreases on the left side of the critical value and increases on the right side of the critical value, the quantity at approximately 447 units is a relative minimum.
The minimum average cost is obtained from
and is calculated as
Since the total daily cost is in dollars and we are dividing by the number of units to get the average cost, the units on the average cost are dollars per unit. This means that a production level of about 447 units gives the lowest average cost of 14.47 dollars per unit.
Figure 6 – The relative minimum for the average cost function.