
Computing Limits Algebraically
In section 10.1, we examined tables and graphs to help us evaluate limits. For instance, to evaluate the limit
we could construct a table of approximate y values near x = 0.
We could also graph the function to get an idea of how the y values behave as x gets closer and closer to 0.
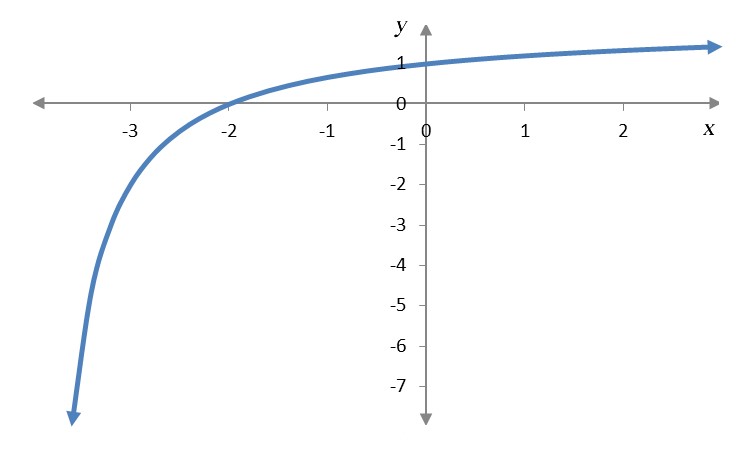
For either representation, as x get closer and closer to 0, the corresponding y value gets closer and closer to 1. This means the value of the limit is 1,

If you look at the table or the graph, you’ll notice that the y value for the expression  is 1 at the value x = 0. This suggests that you could simply substitute into the expression to evaluate the limit. By doing this, we can avoid creating the table or making the graph. In this section, we’ll examine the situations when this strategy works and ways to work around the problems that occur when it is not possible.
Read in Section 10.3
- How can a limit be computed algebraically?
- How do you evaluate limits involving difference quotients?
- Handout: Some Limits with Square Roots (PDF)
- Handout: More Complicated Difference Quotients – Polynomials (PDF)
- Handout: More Complicated Difference Quotients – Rational Function (PDF)
- Handout: More Complicated Difference Quotients – Square Root Functions (PDF)
- Handout: More Complicated Difference Quotients – Polynomials (PDF)
Section 10.3 Workbook (PDF) 8-18-19
Watch Video Playlist
